Volatility Cycle

Volatility Cycle

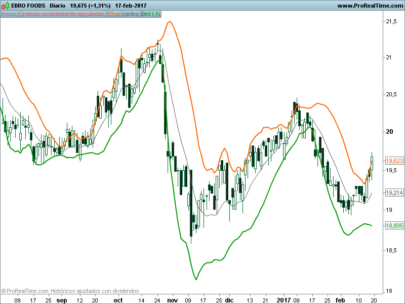
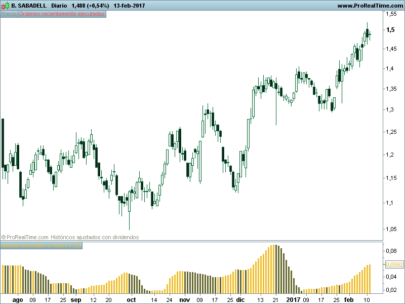
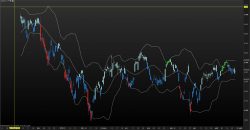
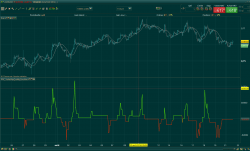
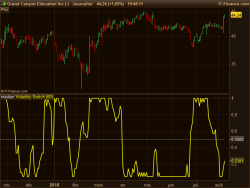
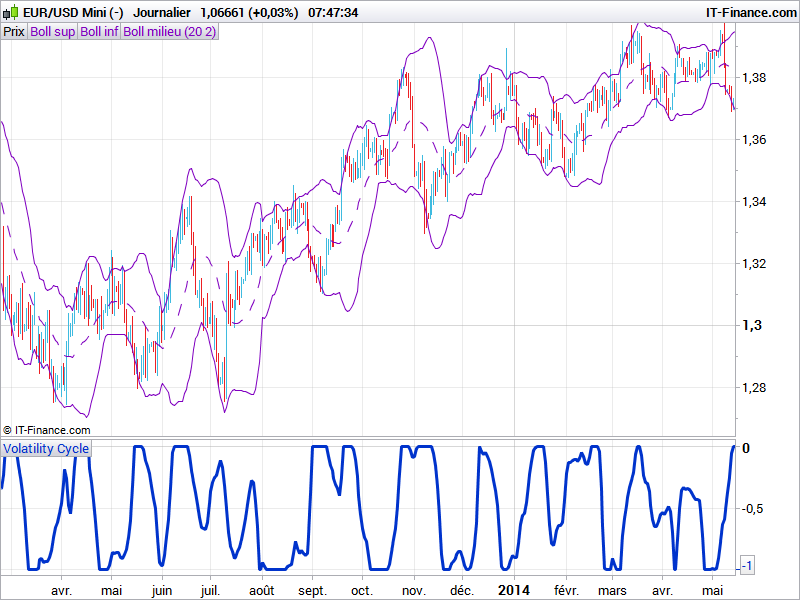
The volatility cycle indicator measure differences between current standard deviation of the price and its highest and lowest within the last “InpBandsPeriod” bars. It results of a bounded oscillator that can be read as:

  • oscillator is low, expect a volatility explosion in the next periods or the end of the current trend
  • oscillator is high, a trend is currently forming

The curve can be smooth much more to avoid false signals but with more lag.

This technical indicator should  be used with other ones to confirm its information.


Share this

Risk disclosure:

No information on this site is investment advice or a solicitation to buy or sell any financial instrument. Past performance is not indicative of future results. Trading may expose you to risk of loss greater than your deposits and is only suitable for experienced investors who have sufficient financial means to bear such risk.

ProRealTime ITF files and other attachments : How to import ITF files into ProRealTime platform?

PRC is also on YouTube, subscribe to our channel for exclusive content and tutorials
avatar
Register or

Likes

avatar avatar avatar avatar avatar avatar avatar
Related users ' posts
Lyam Pareil ne marche pas dommage
ahmedbouaziz89 Bonjour, quand j'ajoute le code ou le fichier dans l'outils screeners de Prorealtime je ne v...
tyvix Bonjour le code marche bien c est juste qu'il n y a pas d opportunité au moment ou vous le...
diegofe_2000 vamos a probarlo
Nicolas Well done supertiti, nicely coded and very accurate.
Dimi.A Beautiful.
Nicolas Thank you for contribution. Please consider that advertising is tolerate as long as you cont...
triss1965@gmail.com  Hi, I cant make it work. And if you doing so much money. Why do you have to sell it? It don...
T-rader Eva... He dosen´t sell anything. He is just a nice guy that want to share on of his strategy...
Pelle Nævestad Thanks Nicolas, this is a keeper!
Chicane23 Hi, when uploaded the WAE isnt showing histogram; only line. Is there a way to modify?
Nicolas Change the way the lines are displayed in the indicator settings window : histogram, lines, ...
Dimi.A Perfect for counter-trend scalping. I like this!
viktorthuns Hi Nicolas! Great work you've done with all your indicators. Just wondering about the code a...
Nicolas the value is not a boolean but an average of an addition of booleans. As stated in the descr...
DerPat Like your zero lag indicators.
xel @DerPat - I don't see any question regarding the indicator.  Anyway, I think I give enough l...
diegofe_2000 Xel, tu eres el creador de este indicador? Bueno te  cuento que es muy bueno para hacer est...
xel Buen día @diegofe_2000 -  Claro, mandalo y por aquí lo probamos en otros instrumentos y si g...
verdi55 At least there should be some moving average that has also reverted into the opposite direct...
verdi55 In addition to the moving average, wait until at least one bar is completely back inside the...
rama This works excellent on range bound I tried , give 90% win rates on dax , 3 min chart. can s...
r.angel It seems that the formula needs a SQRT (that is Vyangzhang = SQRT(...))
RickTrader I think to have annualized view of this historical volatility you will need : Vyangzhang =...
cepamoi Unfortunately, this still does not work: ONCE haOpen = medianprice haOpen = ((Open[1]+High...
Nicolas Force calculation to wait 1 bar of history already loaded: ONCE haOpen = medianprice if b...
cepamoi Now it works. Thanks a lot Nicolas! Here is the full code: // variables : // period ...
Sofitech Bonjour. J'aimerais savoir s'il est possible de "truquer" un peu l'indicateur pour qu'il don...
Maz I actually like this very simple idea. It can also be useful for market micro-structure syst...
Nicolas Thanks Maz, I'll have a look tomorrow.

Top