Volume has to be the most underrated market variable used in technical analysis. But if you know how to analyze and interpret it, you’ll be able to see market turning points develop and anticipate pullbacks and trend changes.
You can figure out whether the Professionals are buying or selling by analyzing:
- Volume transacted at the bid or the ask
- High to low range of the bar, and
- Average trade size.
The best bar chart indicator applies directly to the price window. If you prefer traditional candlesticks, simply change the name “DRAWBARCHART” in the code to “DRAWCANDLE”.
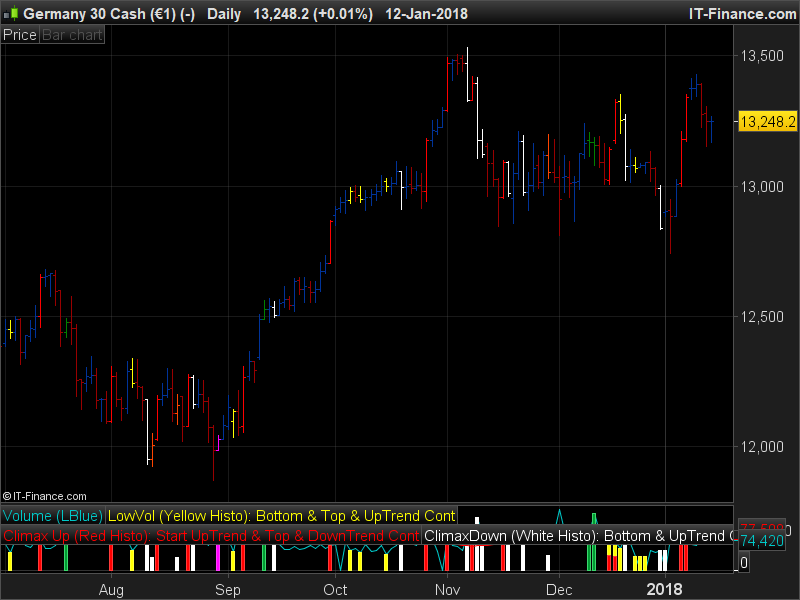
- Volume Climax Up – high volume, high range, up bars (red)
- Volume Climax Down – high volume, high range, down bars (white)
- High Volume Churn – high volume, low range bars (green, PaintBar blue)
- Low Volume – low volume bars (yellow)
- Volume Climax plus High Volume Churn – both the above conditions (magenta)
Source :
- original code and credits from (description taken from http://emini-watch.com/free-stuff/volume-indicator/)
- https://www.prorealcode.com/prorealtime-indicators/better-volume/
123456789101112131415161718192021222324252627282930313233343536373839404142434445464748495051525354555657585960616263646566676869707172737475767778798081828384858687888990919293949596979899100101102103104105106107108109110111112113114115116117118119120121122123124125126127128129130131132133134135136137138139140141142143144145146147148149150151152153154155156157158159160161162163164165166167168169170171172173174175176177178179180181182183184185186187188189190191192// Better Volume Indicator for BarChart// Original idea by emini-watch.com// Better Volume Indicator - Summary// ClimaxUp (Red) : Top, Start Up Trend, Down Trend Continue// ClimaxDown (White): Bottom, Up Trend Continue, Start Down Trend// LowVolume (Yellow): Bottom, Top, Up Trend Continue// Churn (Green): Bottom, Top, Down Trend Continue// ClimaxChurn (Magenta): Top, Down Trend Continue// Parameter: History = Boolean// Parameter: Use2Bars = Boolean// Parameter: Lookback = 20(Default)Lookback = 20ONCE Condition1 = 0ONCE Condition2 = 0ONCE Condition3 = 0ONCE Condition4 = 0ONCE Condition5 = 0ONCE Condition6 = 0ONCE Condition7 = 0ONCE Condition8 = 0ONCE Condition9 = 0ONCE Condition10 = 0ONCE Condition11 = 0ONCE Condition12 = 0ONCE Condition13 = 0ONCE Condition14 = 0ONCE Condition15 = 0ONCE Condition16 = 0ONCE Condition17 = 0ONCE Condition18 = 0ONCE Condition19 = 0ONCE Condition20 = 0VolValue = VolumeLowVolValue = VolValueClimaxUpValue = VolValueClimaxDownValue = VolValueChurnValue = VolValueClimaxChurnValue = VolValue//StopVolValue = VolValue//TrampolineValue = VolValue//AVVolume = Average[Lookback*2](VolValue)//Average[Lookback*2](VolValue)IF 0 = 0 THENBI = 400ELSIF 1 = 1 THENBI = Lookback //BI=LookbackENDIFIF BARINDEX > BI AND Volume <> 0 THENIF Close > Open THENValue1 = Volume * (Range / (2 * Range + Open - Close))ELSIF Close < Open THENValue1= Volume * ((Range + Close - Open) / (2 * Range + Close - Open))ENDIFIF Close = Open THENValue1 = 0.5 * VolumeENDIFValue2 = Volume - Value1Value3 = Value1 + Value2Value4 = Value1 * RangeValue5 = (Value1 - Value2) * RangeValue6 = Value2 * RangeValue7 = (Value2 - Value1) * RangeIF Range <> 0 THENValue8 = Value1 / RangeValue9 = (Value1 - Value2) / RangeValue10 = Value2 / RangeValue11 = (Value2 - Value1) / RangeValue12 = Value3 / RangeENDIFValue13 = Value3 + Value3[1]Value14 = (Value1 + Value1[1]) * (Highest[2](High) - Lowest[2](Low))Value15 = (Value1 + Value1[1] - Value2 - Value2[1]) * (Highest[2](High) - Lowest[2](Low))Value16 = (Value2 + Value2[1]) * (Highest[2](High) - Lowest[2](Low))Value17 = (Value2 + Value2[1] - Value1 - Value1[1]) * (Highest[2](High) - Lowest[2](Low))IF Highest[2](High) <> Lowest[2](Low) THENValue18 = (Value1 + Value1[1]) / (Highest[2](High) - Lowest[2](Low))ENDIFValue19 = (Value1 + Value1[1] - Value2 - Value2[1]) / (Highest[2](High) - Lowest[2](Low))Value20 = (Value2 + Value2[1]) / (Highest[2](High) - Lowest[2](Low))Value21 = (Value2 + Value2[1] - Value1 - Value1[1]) / (Highest[2](High) - Lowest[2](Low))Value22 = Value13 / (Highest[2](High) - Lowest[2](Low))IF 0 = 0 THENCondition1 = Value3 = Lowest [Lookback](Value3)Condition2 = Value4 = Highest[Lookback](Value4) AND Close > OpenCondition3 = Value5 = Highest[Lookback](Value5) AND Close > OpenCondition4 = Value6 = Highest[Lookback](Value6) AND Close < OpenCondition5 = Value7 = Highest[Lookback](Value7) AND Close < OpenCondition6 = Value8 = Lowest [Lookback](Value8) AND Close < OpenCondition7 = Value9 = Lowest [Lookback](Value9) AND Close < OpenCondition8 = Value10 = Lowest [Lookback](Value10) AND Close > OpenCondition9 = Value11 = Lowest [Lookback](Value11) AND Close > OpenCondition10 = Value12 = Highest[Lookback](Value12)ELSIF 1 = 1 THENCondition11 = Value13 = Lowest [Lookback](Value13)Condition12 = Value14 = Highest[Lookback](Value14) AND Close > Open AND Close[1] > Open[1]Condition13 = Value15 = Highest[Lookback](Value15) AND Close > Open AND Close[1] > Open[1]Condition14 = Value16 = Highest[Lookback](Value16) AND Close < Open AND Close[1] < Open[1]Condition15 = Value17 = Highest[Lookback](Value17) AND Close < Open AND Close[1] < Open[1]Condition16 = Value18 = Lowest [Lookback](Value18) AND Close < Open AND Close[1] < Open[1]Condition17 = Value19 = Lowest [Lookback](Value19) AND Close < Open AND Close[1] < Open[1]Condition18 = Value20 = Lowest [Lookback](Value20) AND Close > Open AND Close[1] > Open[1]Condition19 = Value21 = Lowest [Lookback](Value21) AND Close > Open AND Close[1] > Open[1]Condition20 = Value22 = Highest[Lookback](Value22)ENDIF// *********************************************************************************************// Yellow BarChartIF (Condition1 or Condition11) THENLowVol = LowVolValueDRAWBARCHART(Open,High,Low,Close) COLOURED (255,255,0)ELSELowVol = 0ENDIF// Red BarchartIF (Condition2 or Condition3 or Condition8 or Condition9 or Condition12 or Condition13 or Condition18 or Condition19) THENClimaxUp = ClimaxUpValueDRAWBARCHART(Open,High,Low,Close)COLOURED (255,0,0)IF LowVol <> 0 THENClimaxUp = ClimaxUpValue / 2ENDIFELSEClimaxUp = 0ENDIF// White BarchartIF (Condition4 or Condition5 or Condition6 or Condition7 or Condition14 or Condition15 or Condition16 or Condition17) THENClimaxDown = ClimaxDownValueDRAWBARCHART(Open,High,Low,Close)COLOURED (255,255,255)IF LowVol <> 0 OR ClimaxUp <> 0 THENClimaxDown = ClimaxDownValueENDIFELSEClimaxDown = 0ENDIF// Green BarChartIF (Condition10 or Condition20) THENChurn = ChurnValueDRAWBARCHART(Open,High,Low,Close)COLOURED (0,128,0)IF LowVol <> 0 OR ClimaxUp <> 0 OR ClimaxDown <> 0 THENChurn = ChurnValue / 2ENDIFELSEChurn = 0ENDIF//IF (Condition10 or Condition20) AND (Condition2 or Condition3 or Condition4 or Condition5 or Condition6 or Condition7 or Condition8 or Condition9 or Condition12 or Condition13 or Condition14 or Condition15 or Condition16 or Condition17 or Condition18 or Condition19) THEN// Magenta BarChartIF Churn <> 0 AND (ClimaxUp <> 0 OR ClimaxDown <> 0) THENClimaxChurn = ClimaxChurnValueDRAWBARCHART(Open,High,Low,Close)COLOURED (255,0,255)ELSEClimaxChurn = 0ENDIF//StopVolume Orangered BarChartLocalClosingPosition = 1 - (High - Close) / (High - Low)IF Volume > Volume[1] AND Range < Range[1] AND ((High > High[1] AND LocalClosingPosition < 0.4) OR (Low < Low[1] AND LocalClosingPosition > 0.6)) THEN//StopVol = StopVolValue * 1 / 3 // HigherVolume & LowerRange @ HigherHigh or LowerLow - DBlueDRAWBARCHART(Open,High,Low,Close)COLOURED (255,69,0)ELSE//StopVol = 0ENDIF//Trampoline Blue BarChartFOR i = 1 TO 2 // Close togetherIF ((ClimaxChurn[i] > 0 OR ClimaxUp[i] > 0) AND (ClimaxChurn > 0 OR ClimaxUp > 0)) AND ((Close[i] > Open[i] AND Close < Open) OR (Close[i] < Open[i] AND Close > Open)) THEN//Trampoline = TrampolineValue * 1 / 4BREAKDRAWBARCHART(Open,High,Low,Close)COLOURED (0,0,255)ELSE//Trampoline = 0ENDIFNEXTENDIFRETURN
Thanks to Nicolas for this site.
Share this
No information on this site is investment advice or a solicitation to buy or sell any financial instrument. Past performance is not indicative of future results. Trading may expose you to risk of loss greater than your deposits and is only suitable for experienced investors who have sufficient financial means to bear such risk.
ProRealTime ITF files and other attachments :PRC is also on YouTube, subscribe to our channel for exclusive content and tutorials







Hello. It seems that when I reload the chart the candles are looking different than before. Is there a reason for that? Thanks and regards.
I also have the same problem that I can not solve especially on LowVolume (Yellow) … Sorry
No need to apologise, my friend. It is great code. I hope you find a solution soon. Regards.
I think it’s because the lookback period changes at every new bar and that means that many conditions are revised at every bar as well.