

Volume Rsi oversold/overbought
September 10, 2018, 12:31 PM
Indicators
3 Comments
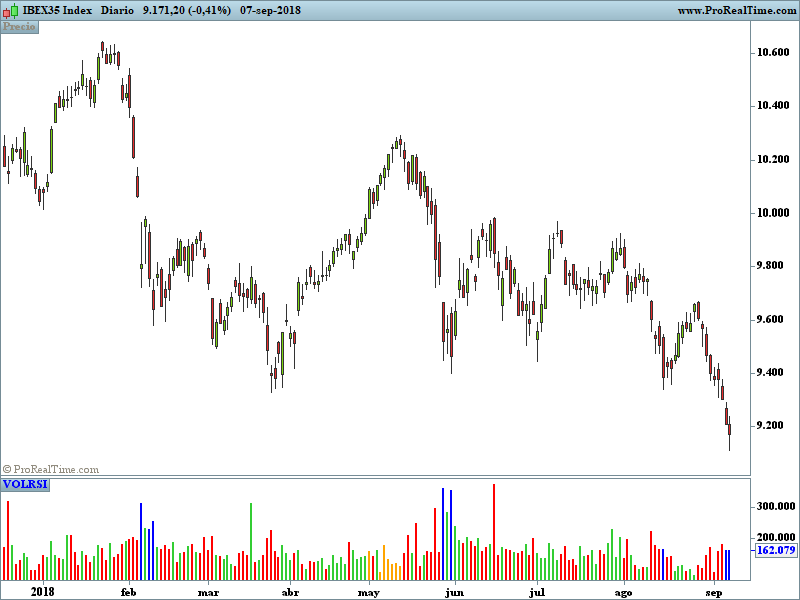
A volume indicator that indicates overbought and oversold based on rsi. this indicator allows you to identify the overbought and oversold areas of the rsi with the colors ;
blue (oversold)
orange (overbought )
on the volume indicator
(adaptation for the Prorealtime v 10.3 platform of the Tradingview indicator.)
REM VOLUME RSI
//// by JonathanDeneaul on platform Tradingview
//adapted for the Prorealtime v10.3 platform by bolsatrilera
//@version=3

//RSI
src = close
len = 14//minval=1, title="RSI")
upper=70 //minval=1, title="Upper"
lower=30 //minval=1, title="Lower"
rmaup=max(src-src[1],0)
up =WilderAverage[len](rmaup)
rmadown=-min(src-src[1],0)
down = WilderAverage[len](rmadown)

if down =0 then
 rrsi= 100
elsif up = 0 then
 rrsi = 0
else
 rrsi = 100 - (100 / (1 + up / down))
endif

//Volume
if rrsi>upper then
 Vol =volume
 r=255
 g=165
 b=0
elsif  rrsi<lower then
 Vol =volume
 r=0
 g=0
 b=255
elsif  close<open then
 Vol =volume
 r=255
 g=0
 b=0
elsif close>=open then
 Vol =volume
 r=50
 g=205
 b=50
endif

return Vol coloured(r,g,b)style(histogram)as "VOLRSI"
Download
Filename:
Volume-RSI.itf
Downloads:
325
Master
Developer by day, aspiring writer by night. Still compiling my bio... Error 404: presentation not found.
Author’s Profile
Loading...