Volume Rsi oversold/overbought

v10.3
Volume Rsi oversold/overbought

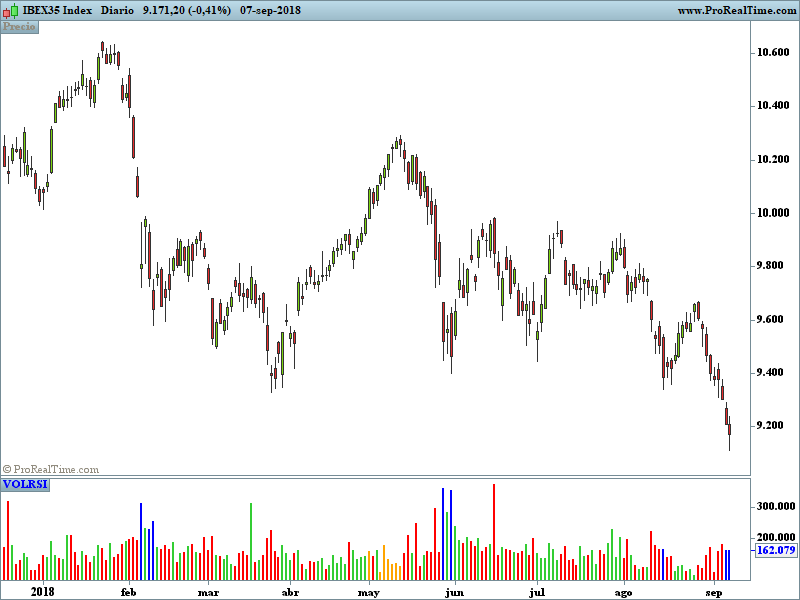
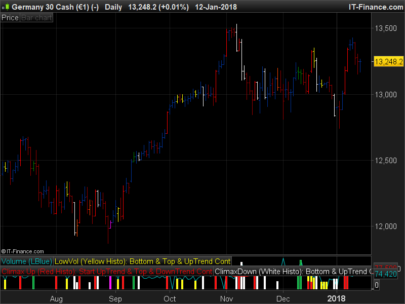
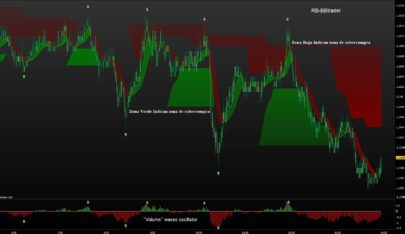
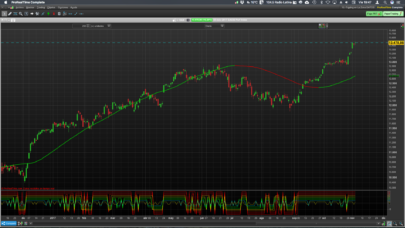
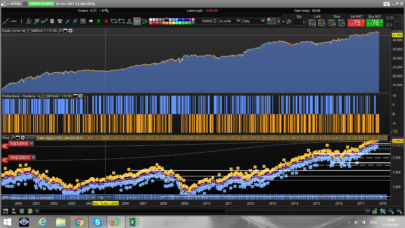
A volume indicator that indicates overbought and oversold based on rsi. this indicator allows you to identify the overbought and oversold areas of the rsi with the colors ;

blue (oversold)

orange (overbought )

on the volume indicator

(adaptation for the Prorealtime v 10.3  platform of the Tradingview indicator.)

Share this

Risk disclosure:

No information on this site is investment advice or a solicitation to buy or sell any financial instrument. Past performance is not indicative of future results. Trading may expose you to risk of loss greater than your deposits and is only suitable for experienced investors who have sufficient financial means to bear such risk.

ProRealTime ITF files and other attachments : How to import ITF files into ProRealTime platform?

PRC is also on YouTube, subscribe to our channel for exclusive content and tutorials

  1. luxrun • 09/10/2018 #

    Thanks, bolsatrilera, for a very good and solid screener!

  2. luxrun • 09/10/2018 #

    sorry… indicator!

  3. Lily Rios • 09/10/2018 #

    Gracias por el indicador, tengo una pregunta necesito programar un screener de valores que entre otras condiciones el RSI de ayer haya sido menor a 30 pero el de hoy es mayor a 30. Me podrías ayudar?

avatar
Register or

Likes

avatar avatar avatar avatar avatar avatar avatar avatar avatar avatar avatar avatar avatar
Related users ' posts
gabri Ha ragione in computer, ho sbagliato io BullAD = summation[period](ADvolbull*((Close-Low) –...
marcov66 Perfetto! Funziona. Grazie di tutto!
SkrHugo Bonjour, J'essaye d'utiliser le script avec le graphique renko mais sa ne marche pas, quelq...
AG1 Thanks Nicolas Still a problem in line 29 Please take a look. thanks again Alex
Nicolas code is modified in the above post, use that one.
AG1 Still a problem in line 29 Please take a look. thanks again Alex
Tonicejudo Hola Nicolas, a ver si me puedes ayudar. Hay un indicador que se llama volumen stop de bolsa...
Nicolas Utilice los foros para hacer preguntas no relacionadas con la página actual ...
styrke Hello Nicolas, Nice screener, I appreciate the way you always try to condense at maximum th...
Nicolas There's no particular reason. RSI is widely use with its default period and results seems re...
Alai-n I also have the same problem that I can not solve especially on LowVolume (Yellow) ... Sorry
Mert No need to apologise, my friend. It is great code. I hope you find a solution soon. Regards.
gabri I think it's because the lookback period changes at every new bar and that means that many c...
MaoRai54 Hi, first of all Happy New Year. Well, I've inserted your indicator in DAX 1h but I cann...
Vinks_o_7 Hi Mao Happy New Year ! This is just an improved RSI where you plot a standard price momen...
Angel Perez Ciao Francesco. First of all thanks for the indicator and also fro the screener. I do have a...
PSIDIO Ciao to you all, I also have a question and would be very happy for a helpful comment. I a...
SpreadBetMH Hi there, I have V11.1. I get the Indicator but no Arrows on the price. Kind Regards...
Alai-n Ciao Francesco, sei ancora in giro?
Metodi97 This indicator is great but can someone create strategy based on the same indicator it will ...
Giuseppe68 ciao, ho provato l'indicatore e mi sembra interessante, ma in fase di backtest non riesco ad...
poldoposta veramente bello.....complimenti
Nicolas
7 years ago
TradeNavigator RSI
TradeNavigator RSI
10
Indicators
Nicolas Tutte le impostazioni che hanno la parola "period" sono quelle dedicate ai periodi di cambio...
GianfrancoCeck Le chiedo una ultima cosa, ossia se è possibile personalizzare l'indicatore con una scritta ...
Nicolas Spiacente che non sia possibile, le coordinate grafiche non sono in pixel ma nel prezzo e ne...
Nicolas Your picture is too small, but for sure the problem is about the fact you are still using v1...
Rory Dryden Thanks. This looks useful.
Edelmiro Un millón... de gracias... me gustaría más, poder ofrecer euros; pero va a ser que no puedo,...
rb-72 Thank you, area of twist by dilatacion of the price, missing part of the code that is not pu...
Thomas007 after reading your blog now I understand why there is only a part of your code here. I'm try...
Juanjo Hola¡¡ la estrategia se podria aplicar sobre acciones con marco temporal diario?? gracias.
Jessar Hello, could you tell me how to use this indicator? I think the simplest things can still be...
rb-72 5 Minutes, 15 Minutes, The most effective 1 Hour below 0 or above 0 as a turn signal in the ...
Andraxx Interpretación de el indicador??? Gracias
TAC Bolsa Oscilador que hace una medición ponderara basado en la distancia entre precio y una media Mó...
Mirko Vaglio Interesting idea to bypass the limit of PRT about multiple timeframe, and I am just trying t...
Mirko Vaglio Looking a little bit more, now I understand what had to be absolutely obvious from the first...
Seb nice code! I'm trying to use your method to do a higher timeframe EMA, without success yet. ...
Francesco78 @snucke the results are not the same because the pictures refers to a few years ago. I am no...
snucke @Francesco78 i mean the results differ when i test on my own. so im curious of what the p...
sfl still working, using with filters like : trendFilterUp=close>average[190](close) tren...
Nicolas Better to download the file from the page and import it into your platform in order to not c...
marcov66 Hi Nicolas, thanks for sharing the VWAP Date Indicator. It is really powerful. Nevertheless,...
Nicolas Are you sure you are using the same exact date, hours, minutes, seconds for anchor?
julien1978 changing the trendDetectionLength setting does not seem to have any effect on the wave calcu...
arran i can't seem to get this indicator to work on forex pairs. it works great on indices etc. An...
Nicolas Indicator needs Volume, and there are no volumes with forex pairs with IG.

Top