Volume Weighted Moving Average (VWMA)

Volume Weighted Moving Average (VWMA)

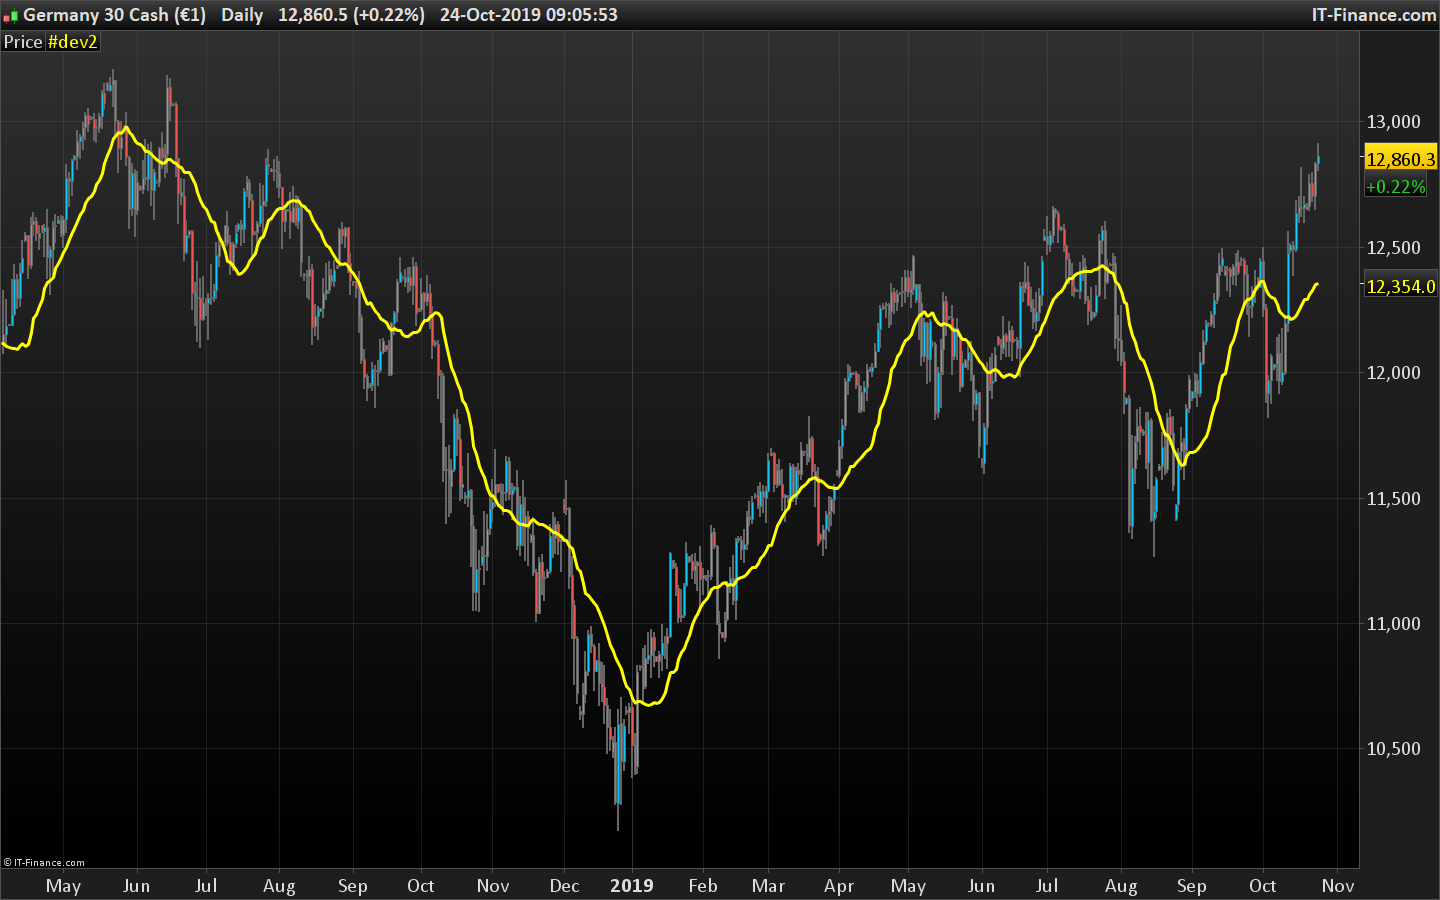
I know the Volume Weighted Moving Average indicator is available in PRT as an indicator but the code is not available for strategy building so I created the code.

Formula: 3-Day VWMA = (C1*V1 + C2*V2 + C3*V3) / (V1+ V2+ V3)

Where C is close and V is volume

Basic strategy as from “https://www.tradingsetupsreview.com/volume-weighted-moving-average-vwma/

To fully make use of the Volume Weighted Moving Average (VWMA), compare it with a SMA that does not include volume.

The SMA is a benchmark. This means that you should choose the same look-back period for both the SMA and the VWMA.  The only difference between the two moving averages is volume weighting.

What matters here is the gap between the VWMA and the SMA. Their difference shows the effect of volume weighting.

Generally, volume should increase along with the trend and decrease against it. Hence, generally, if the VWMA is above the SMA, it means that volume has been higher on up days. When the VWMA is below the SMA, it shows that down days had higher volume.

The Volume Weighted Moving Average has the ability to help discover emerging trends, identify existing ones and signal the end of a move.

What it does is to incorporate not only the last x periods of price into its calculation but also the average volume during those x periods. That means when the volume is stronger, the VWMA will follow price more closely, and when volume falls off, it will mimic a simple moving average. The VWMA does not make a difference between buying and selling volume, only the strength of volume itself, so it will simply get closer to the close of the day when volume increased on that day, no matter whether it is a bearish or a bullish close.

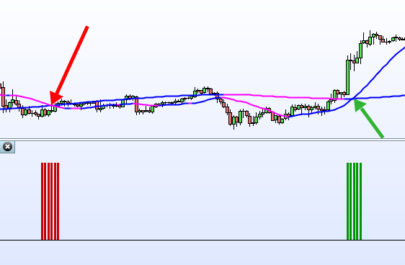
Important is – if the VWMA is above the SMA, we are moving in an uptrend, and when it is below, we do have bearish implications. Or even simpler, as long as the VWMA is between price and the SMA, we are trending in that direction.

Share this

Risk disclosure:

No information on this site is investment advice or a solicitation to buy or sell any financial instrument. Past performance is not indicative of future results. Trading may expose you to risk of loss greater than your deposits and is only suitable for experienced investors who have sufficient financial means to bear such risk.

ProRealTime ITF files and other attachments : How to import ITF files into ProRealTime platform?

PRC is also on YouTube, subscribe to our channel for exclusive content and tutorials
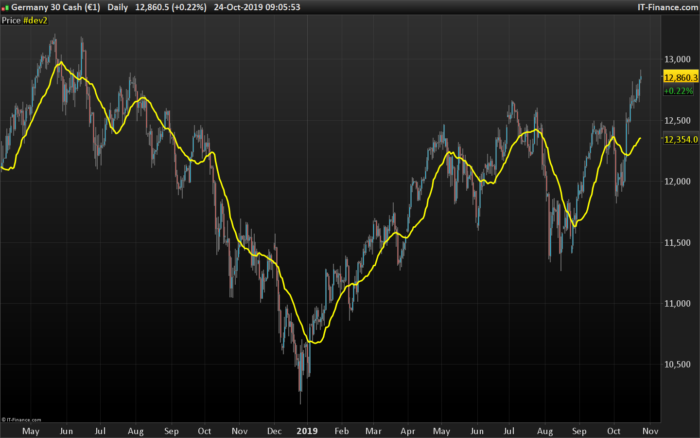
  1. Marie-Eve Vergoz • 10/24/2019 #

    Bonsoir –
    Voici l’erreur qui est signalée lorsque je souhaite utiliser cet indicateur : il est demandé de définir “lenght” – Pouvez-vous m’aider ? Merci infiniment

avatar
Register or

Likes

avatar avatar avatar avatar avatar avatar avatar avatar avatar avatar
Related users ' posts
Nicolas Good job Gabri, I confirm that with the new ProRealTime v11, everyone will be able to use in...
Slowlyslowly can u just help me with the exact definition of percbox , mm and period to understand will a...
Real Pro Great work gabri. I have this coded on Amibroker and I have done lots of backtesting but ne...
gabri Hi Real Pro, this indicator assists novices of the Wyckoff system. Wyckoff himself thought t...
tatie hi Gabri, I just came across the wyckoff method and was looking for the weiss wave indica...
Leo I don't know, I just copy paste the strategy. The optimisation of the values I wrote them in...
bertrandpinoy hello Leo I'm spending time on your strategy code. do you agree to try to include this code ...
bertrandpinoy //version a: ajout filtre MM defparam cumulateorders=false // --- paramètres taille =...
Jesper Great share!
capgros Bonjour @Nicolas, Thanks a lot for this tool, it is very useful for me. I would like to s...
Hans63 Would you add the possibility to color also the Heikin Ashi and bar chart?
Nicolas That's possible, please open a new topic in the indicator forum explaining what you need exa...
Nicolas Change line 62 with: drawcandle(flup,fldn,flup,fldn) coloured(169,169,169,80) bordercolor(16...
DimKar Thank you very much from Greece sir , have a nice day ....!!!! Really i do not have words...
mit_ose Bonjour, J'ai d'excellents résultats avec cet indicateur simple et efficace; Merci beaucoup;
ottimo Thank you Nicolas, great indicator, N. 1
tikigai Merci Nicolas! First Happy new Year 2020. Very good indicator BUT (yes the french "oui, m...
Nicolas Whats prorealtime version? Did you try in version prior to v11? indicator's call and loop ca...
Nicolas Yes, that's how it goes when using loops..
JosephFelix Hi, Could I please have help with adding these indicators 'on price'? Every indicator that I...
Nicolas Just add it on price by clicking the wrench on the left upper side of the price chart.
XXXXVII Excellent indicateur ! Déterminer une tendance est devenu un jeu d'enfants ! Félicitation......
gregoire bonjour nicolas j ai cherché partout sur le net et impossible de trouvé ce que je recherch...
Nicolas Merci de poster une demande dans le forum des indicateurs, ainsi on pourra le coder dans ce ...
eckaw Hi Nicolas, I'm using this indicator when there is confluence over 3 different timeframes (5...
Nicolas Yes it is indeed possible. Create a topic in the screener forum and explain what you need an...
KyleReed i've been using this for a few days now and it's really helped me a lot in timing the execut...
Ben Ji Bonjour Nicolas, je souhaiterais exploiter votre screener sur la plateforme TradingView. Pou...
Nicolas Non désolé, je ne fournis pas de support pour cette plateforme.
luxrun Thanks, bolsatrilera, for a very good and solid screener!
luxrun sorry... indicator!
Lily Rios Gracias por el indicador, tengo una pregunta necesito programar un screener de valores que e...
mmoren44 no esta el color azul (Fade //Blue), No aparece en las barras el color azul.
larouedegann changer fade coloured (0,0,255)
Nicolas Apply it on the price chart. The indicator plot just one single line. There are two in the...
jamesoc Hi Nicolas, do you happen to know if there is an indicator that can be applied to charts, to...
gustavobp Buenos dias Nicolas, al agregar tu indicador no me reconoce la variable Price ni en la linea...
Nicolas 1. yes 2. maybe yes?! 3. why not?
patapouf Bonjour Nicolas. Je viens de découvrir cet indicateur, que je trouve bien intéressant Mais...
Nicolas Tu peux modifier le paramètre "scalefactor" pour adapter la hauteur des barres à ton graphiq...

Top