Volume Weighted Moving Average (VWMA)

Volume Weighted Moving Average (VWMA)

I know the Volume Weighted Moving Average indicator is available in PRT as an indicator but the code is not available for strategy building so I created the code.

Formula: 3-Day VWMA = (C1*V1 + C2*V2 + C3*V3) / (V1+ V2+ V3)

Where C is close and V is volume

Basic strategy as from “https://www.tradingsetupsreview.com/volume-weighted-moving-average-vwma/

To fully make use of the Volume Weighted Moving Average (VWMA), compare it with a SMA that does not include volume.

The SMA is a benchmark. This means that you should choose the same look-back period for both the SMA and the VWMA.  The only difference between the two moving averages is volume weighting.

What matters here is the gap between the VWMA and the SMA. Their difference shows the effect of volume weighting.

Generally, volume should increase along with the trend and decrease against it. Hence, generally, if the VWMA is above the SMA, it means that volume has been higher on up days. When the VWMA is below the SMA, it shows that down days had higher volume.

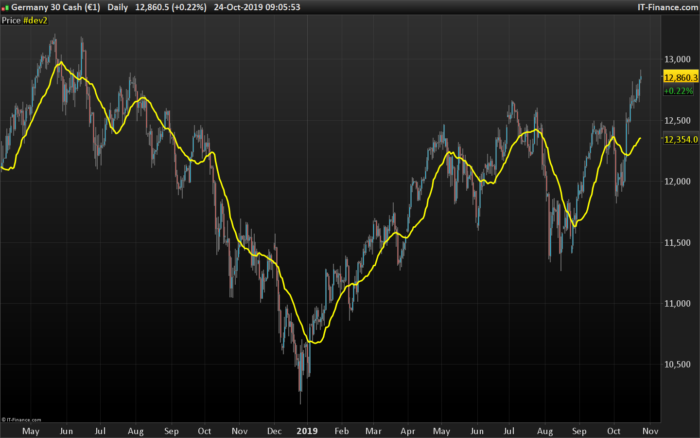
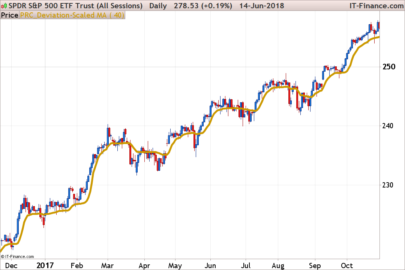
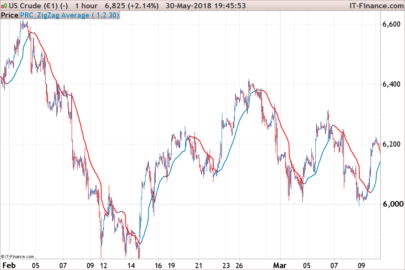
The Volume Weighted Moving Average has the ability to help discover emerging trends, identify existing ones and signal the end of a move.

What it does is to incorporate not only the last x periods of price into its calculation but also the average volume during those x periods. That means when the volume is stronger, the VWMA will follow price more closely, and when volume falls off, it will mimic a simple moving average. The VWMA does not make a difference between buying and selling volume, only the strength of volume itself, so it will simply get closer to the close of the day when volume increased on that day, no matter whether it is a bearish or a bullish close.

Important is – if the VWMA is above the SMA, we are moving in an uptrend, and when it is below, we do have bearish implications. Or even simpler, as long as the VWMA is between price and the SMA, we are trending in that direction.

Share this

Risk disclosure:

No information on this site is investment advice or a solicitation to buy or sell any financial instrument. Past performance is not indicative of future results. Trading may expose you to risk of loss greater than your deposits and is only suitable for experienced investors who have sufficient financial means to bear such risk.

ProRealTime ITF files and other attachments : How to import ITF files into ProRealTime platform?

PRC is also on YouTube, subscribe to our channel for exclusive content and tutorials

  1. Marie-Eve Vergoz • 10/24/2019 #

    Bonsoir –
    Voici l’erreur qui est signalée lorsque je souhaite utiliser cet indicateur : il est demandé de définir “lenght” – Pouvez-vous m’aider ? Merci infiniment

avatar
Register or

Likes

avatar avatar avatar avatar avatar avatar avatar avatar avatar avatar
Related users ' posts
tradingpro salve io faccio spread trading e volevo sapere come impostare un profitto da chiudere in a...
Nicolas Per favore non fare domande generali, non correlate al post. Usa invece il forum.
Bard Incredible, that is the clearest depiction of the trend I've ever seen Nicolas. (I just chan...
bolsatrilera EM MONEY FLOW INDEX + ALERTS //@version=3 // on platform Tradingview by DreamsDefined //a...
Carlos Garcia Enorme. Gracias!
Andraxx Buen indicador.... Gracias
Vonasi Forum discussion on these indicators can be found here: https://www.prorealcode.com/topic/av...
jennr29 Hi. Is it possible to convert this code to an mq4 file?
Nicolas Sorry but our website is dedicated to prorealtime programming. However, you can ask for priv...
TAC Bolsa All indicators share some code of other TAC indicators that improve the functioning of this ...
ramonjp Hi Tac, Great job. Please, can you provide latest code version of this indicator without ...
Tze Khai Lim Hi Tac, pls provide latest code version of this indicator. Thanks in advance.
Appsoluxions Hi Nicolas, do you have the MT4 version of the indicator? I am not sure if these kind of que...
Nicolas Hi, don't have one sorry. But you can still ask for private coding through our programming s...
Appsoluxions Cool. Thanks for the response.
TAC Bolsa Estas equivocado al 99,9%. La correlación entre las series de precios y volúmenes las des...
Domenec Si hablas de un indice regional como el Ibex es posible que sea asi yo nunca lo he operado y...
TAC Bolsa Regional de Mostoles, en una cosa tienes razón mejor dejarlo aquí...
Xusto Hello, Fully Agree, I will update it with your advice. Btw Can would you like share you co...
Niklas johansson hägglund do you now if it's possible to use this strategy with this code in tradingview also?
Alexander9 This code for metastock ?, can for amibroker . Thanks
TACBOLSA
7 years ago
luxrun Thank you so much Tac BOLSA, I can not post the picture tonight I'll try tomorrow. I loaded ...
TAC Bolsa A new version of TAC Volume HPI DIV10.4 is available. that marks the divergence In the fo...
Raymundo Buenas tardes. Como puedo descargar algunos indicadores de esta pagina ?
rama I want to use this indicator in trading system, it says zig zag is obsolete and not supported
Nicolas Right, due to its repainting behavior, the zigzag is not allowed in automated trading with r...
rama I noticed it changes as time progress, I am 7 as the average, how many period it wont chang...
mangiaragni Buongiorno io non riesco a visualizzare nessun tipo di volume , mi torna sempre una linea dr...
Nicolas Assicurati che lo strumento che stai guardando abbia dei volumi! È il caso?
Gordon101 Hi when I added your Guppy indicator to my chart it went below the chart beside the oscilla...
Nicolas Add it on the price by using the wrench located on the left upper side of your price chart.
Gordon101 Thanks Nicolas, worked a treat.
Rafa And the PriceMAPeriod? aren´t the same?
Nicolas The PriceMAPeriod is the period to make the average of all the last X medianprice found.
Rafa Thanks a lot Nicolás. Have a nice day
Carlos Garcia If price tags the lower BBand, look for IIIX has positive values to enter a trade. Converse...
Thally Thanks for the quick response Nicholas. Would you have any idea how to resolve. Manually ref...
Thally Do you think adjusting the below code might help? newperiod = minuteminute[1] if newperi...
Nicolas There is no "second" instruction.
ak5hay2 Works like crazy on bitcoin. Use different timeframes. Thanks a lot Doc!!!
richyowen Hi, great code thanks. Very new to this forum. Is there a way to add a 100point target on an...
lisamitch50 Morning all, Just backtested on quite a few instruments, worked well on backtesting, but tel...
YvesRobert Merci beaucoup Nicolas. Existe t'il un petit programme qui permet de tracer sur la graphe en...
Nicolas Oui il y a celui ci: https://market.prorealcode.com/product/prt-renko/?lang=fr
YvesRobert Bonjour Nicolas, j'ai une question technique à te poser. Je visualise souvent le cours en RE...
GenesisEX Thank you all for your contributions this is a great submission. Thanks for your inputs.
tino Bonjour nicolas. Je ne parviens pas à recopier le screener de l'indicateur. Auriez vous la g...
Nicolas Quel screener svp? C'est dans un des sujets du forum? Merci de fournir le lien.
gabri Ha ragione in computer, ho sbagliato io BullAD = summation[period](ADvolbull*((Close-Low) –...
marcov66 Perfetto! Funziona. Grazie di tutto!
SkrHugo Bonjour, J'essaye d'utiliser le script avec le graphique renko mais sa ne marche pas, quelq...

Top