Introduction
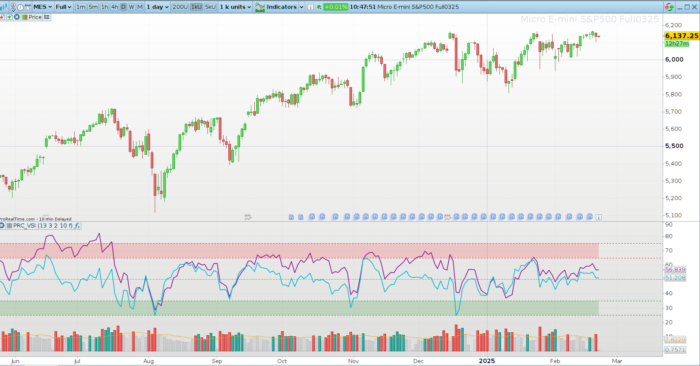
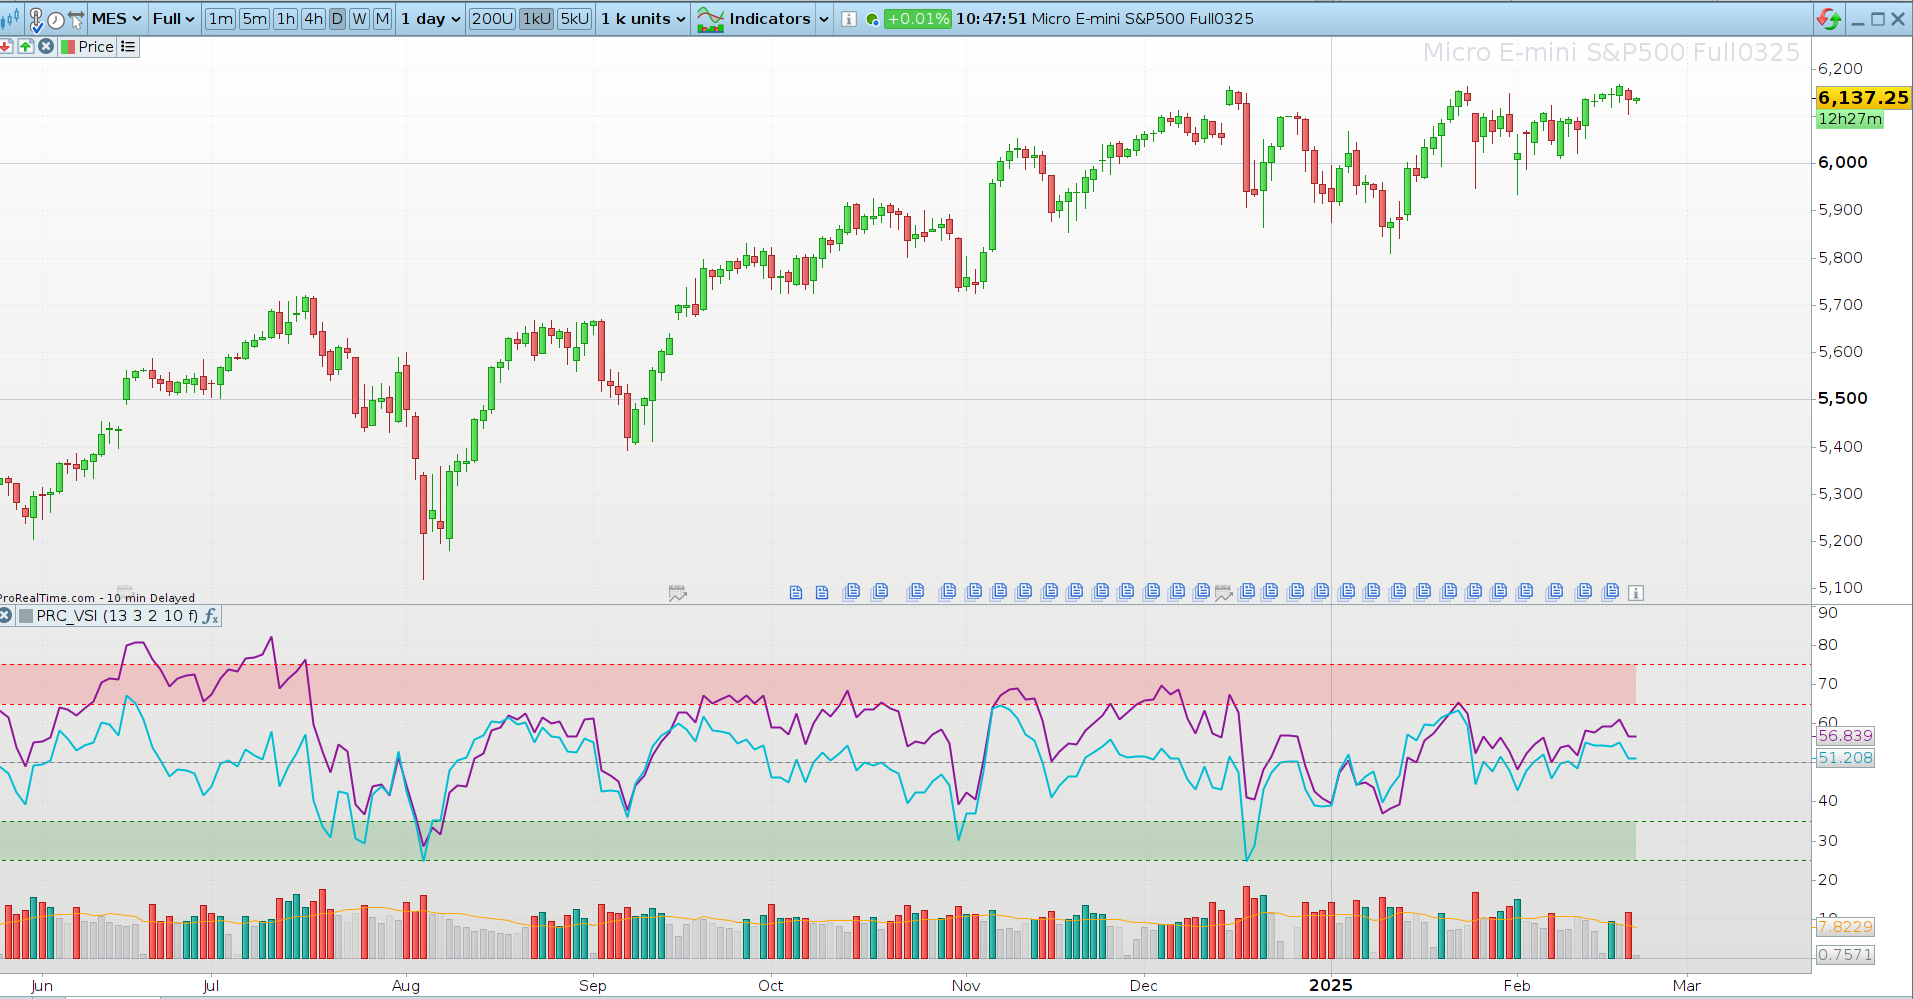
The VSI (Volume Strength Indicator) is a powerful tool that combines Relative Strength Index (RSI) calculations with various volume-based metrics to provide a clearer picture of market momentum. Traditional RSI focuses solely on price movements, but VSI enhances this by integrating volume strength, offering traders deeper insights into price action confirmation and potential reversals.
By incorporating different volume sources such as On-Balance Volume (OBV), Accumulation/Distribution (ADL), Elder’s Force Index (EFI), and Price Volume Trend (PVT), the VSI indicator provides a multi-dimensional approach to identifying market strength and weakness.
How VSI Works
The VSI consists of two main components:
- Price-based RSI: Measures the relative strength of price over a chosen period.
- Volume-based RSI (customized): Instead of price, it applies RSI to one of the selected volume indicators.
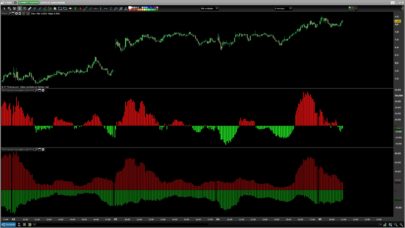
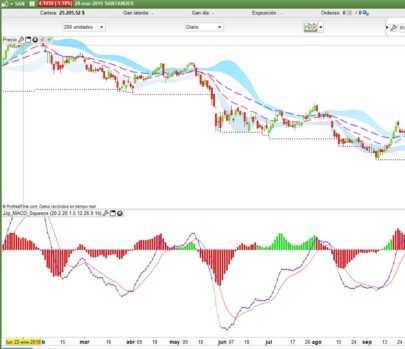
Additionally, VSI features a volume histogram, which normalizes volume fluctuations and provides a visual representation of buying and selling pressure in the market.
Understanding VSI Components
1. RSI Calculation on Price
The first step in the VSI calculation is applying a standard RSI to the price data. This is done using a default length of 13 periods, but can be adjusted based on user preference. The result is further smoothed using a linear regression filter for better signal clarity.
2. RSI on Volume-Based Metrics
VSI allows traders to choose different volume indicators as the base for the RSI calculation:
- OBV (On-Balance Volume): Measures cumulative volume flow by adding volume on up days and subtracting volume on down days.
- ADL (Accumulation/Distribution Line): Uses price and volume to assess buying or selling pressure.
- EFI (Elder’s Force Index): Combines price change and volume to measure the strength of buyers and sellers.
- PVT (Price Volume Trend): Similar to OBV but incorporates percentage price changes.
The selected volume-based data is then processed using an RSI calculation, with the same length parameter as the price RSI. Like the price RSI, it is smoothed using a linear regression function.
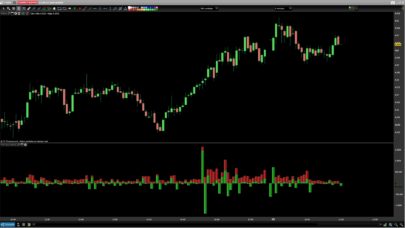
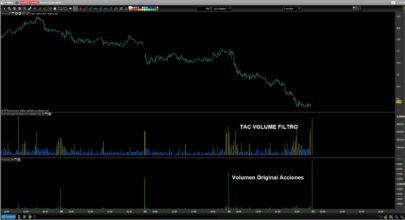
3. Volume Histogram Calculation
The VSI also includes a volume histogram that helps visualize market activity. This histogram is calculated by:
- Comparing current volume to the average volume over the same period.
- Normalizing the volume fluctuations relative to the historical average.
- Assigning colors based on volume strength and price direction.
Additionally, users can choose between:
- Volume Oscillator: Compares short-term and long-term volume averages.
- Simple Moving Average (SMA) of Volume: A smoother approach to tracking volume trends.
Trading with VSI: How to Interpret Signals
The VSI provides multiple ways to identify trend strength, reversals, and divergences:
- Overbought & Oversold Conditions:
- Above 75 → Overbought (potential selling pressure).
- Below 25 → Oversold (potential buying pressure).
- Mid-Level Confirmation:
- 50 level → Acts as a neutral zone.
- Divergences:
- If Price RSI and Volume RSI move in opposite directions, it may signal an upcoming trend reversal.
- A strong volume RSI breakout with price stagnation could indicate hidden buying/selling pressure.
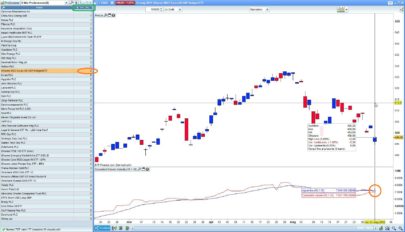
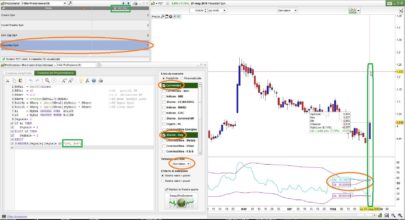
Configuring VSI in ProRealTime
VSI allows traders to customize parameters based on their trading style:
| Parameter | Description | Default Value |
|---|---|---|
length |
RSI period length | 13 |
addRsiX |
Volume-based RSI source (1=OBV, 2=ADL, 3=EFI, 4=PVT) | 1 |
smooth |
Smoothing factor for RSI | 2 |
size |
Histogram scaling factor | 10 |
volComp |
Histogram type (1=Volume Oscillator, 0=SMA) | 1 |
Adjusting these values helps traders fine-tune VSI to match different market conditions and asset volatility.
VSI Code in ProRealTime
|
1 2 3 4 5 6 7 8 9 10 11 12 13 14 15 16 17 18 19 20 21 22 23 24 25 26 27 28 29 30 31 32 33 34 35 36 37 38 39 40 41 42 43 44 45 46 47 48 49 50 51 52 53 54 55 56 57 58 59 60 61 62 63 64 65 66 67 68 69 70 71 72 73 74 75 76 77 78 79 80 81 82 83 84 85 86 87 88 89 90 91 92 93 94 95 96 97 98 99 100 101 102 103 104 105 106 107 108 109 110 |
//------------------------------------------------------// //PRC_VSI Volume Strength //version = 0 //21.02.2025 //Iván González @ www.prorealcode.com //Sharing ProRealTime knowledge //------------------------------------------------------// // Input //------------------------------------------------------// length=13 // Length addRsiX=1 // Relative Strength of 1=On Balance Volume 2=Accumulation/Distribution 3=Elders Force index 4=Price Volume Trend smooth=2 // Smooth RSI size= 10 // Histogram size volComp=1 // Histogram companion 1=volume oscillator 0=Moving average //------------------------------------------------------// // RSI //------------------------------------------------------// myrsi=rsi[length](close) sRsi=LinearRegression[smooth](myrsi) if addRsiX=1 then if close=close[1] then src=0 elsif close>close[1] then src=volume elsif close<close[1] then src=-volume endif CumSrc=cumsum(src) rsix=rsi[length](CumSrc) elsif addRsiX=2 then // Accumulation/Distribution if close=high and close=low or high=low then src=0 else src=(2*close-low-high)/(high-low)*volume endif Cumsrc=cumsum(src) rsix=rsi[length](CumSrc) elsif addRsiX=3 then // Elders Force Index src=average[length,1]((close-close[1])*volume) rsix=rsi[length](Src) elsif addRsiX=4 then // Price Volume Trend src=(close-close[1])/close[1]*volume Cumsrc=cumsum(src) rsix=rsi[length](CumSrc) endif sRsix=LinearRegression[smooth](rsix) //------------------------------------------------------// // Volume Histogram //------------------------------------------------------// vAvg=average[length](volume) rvAvg=average[length](volume*size/vAvg) B=volume*(close-low)/(high-low)/vAvg*size S=volume*(high-close)/(high-low)/vAvg*size if volComp then volx=(average[5,1](volume)-average[10,1](volume))/average[10,1](volume)*100 else volx=rvAvg endif //------------------------------------------------------// // Plot //------------------------------------------------------// volHist=volume/vAvg*size if open>close then if volume/vAvg*abs(size)>abs(rvAvg) then r=239 g=83 b=80 a=255 else r=120 g=123 b=134 a=25 endif else if volume/vAvg*abs(size)>abs(rvAvg) then r=36 g=166 b=154 a=255 else r=120 g=123 b=134 a=55 endif endif //------------------------------------------------------// //Overbougth drawhline(75)coloured("red")style(dottedline3) drawhline(65)coloured("red")style(dottedline3) colorbetween(75,65,"red",40) // Middle drawhline(50)coloured("grey")style(dottedline3) //OverSold drawhline(35)coloured("green")style(dottedline3) drawhline(25)coloured("green")style(dottedline3) colorbetween(35,25,"green",40) //------------------------------------------------------// return volHist coloured(r,g,b,a)style(histogram), volx coloured("orange"), srsi as "Relative Strength of price" coloured(142,21,153)style(line,2), srsix as "Relative Strength of Volume" coloured(0,188,212)style(line,2) |
Conclusion & Best Practices
The VSI indicator is a powerful enhancement over traditional RSI, allowing traders to integrate volume dynamics into their analysis. By using VSI, traders can:
✅ Confirm RSI signals with volume strength.
✅ Identify divergences that indicate hidden buying or selling pressure.
✅ Adjust settings to adapt to different market conditions.
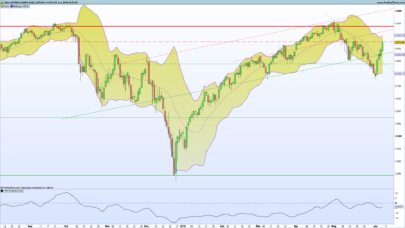
To maximize its potential, VSI can be combined with trend indicators like moving averages or Bollinger Bands to improve accuracy. Whether used for trend-following or reversal trading, VSI provides a deeper, more complete view of market momentum.
Share this
No information on this site is investment advice or a solicitation to buy or sell any financial instrument. Past performance is not indicative of future results. Trading may expose you to risk of loss greater than your deposits and is only suitable for experienced investors who have sufficient financial means to bear such risk.
ProRealTime ITF files and other attachments :
Find other exclusive trading pro-tools on ![]()
PRC is also on YouTube, subscribe to our channel for exclusive content and tutorials


fantastico,