







Waddah Attar Explosion
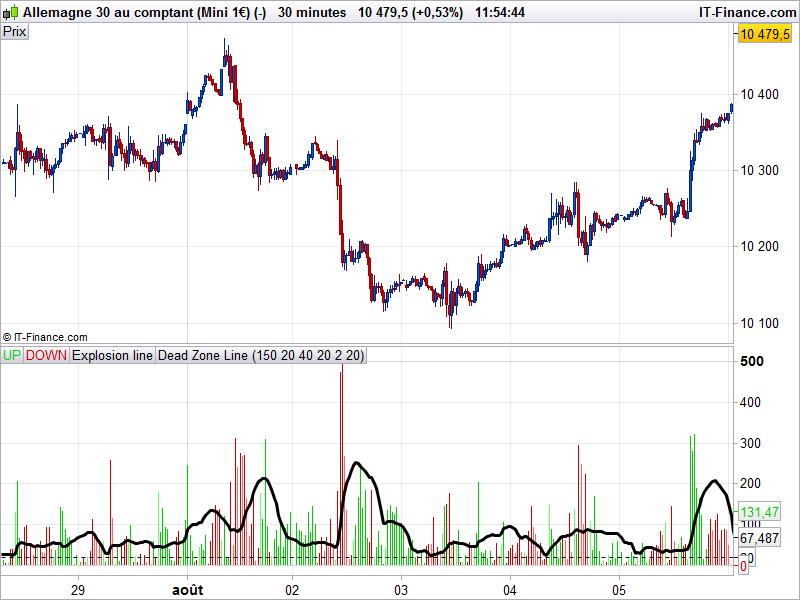
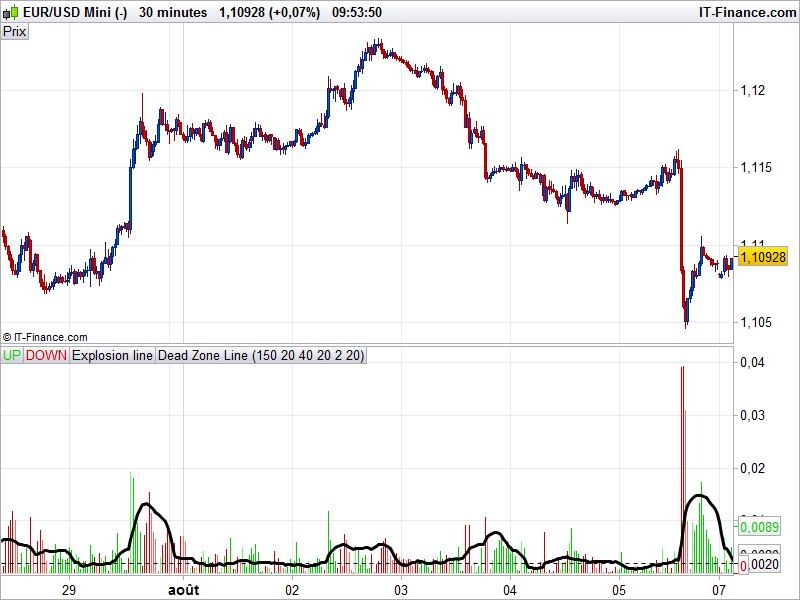
The Waddah Attar explosion indicator is a well known indi in the forex community all over the web. It measures the price volatility “explosion” with the help of a difference between upper and lower bollinger bands (also known as “squeeze”) and its direction and with a slow MACD advance or decline weighted with a coefficient (sensitivity=150).
A “deadzone” of x pips/points is at 20 points by default, but should be adjusted to the traded instrument.
If green or red oscillator histogram breach the “Explosion Line” above the dead zone, it’s a signal.
This indicator act pretty much as a scalper in lower timeframe, but I found it useful with different timeframe comparison in higher ones in the past (M30/H1/H4).
// -- parameters
//sensitivity = 150
//fastLength=20 //"FastEMA Length"
//slowLength=40 //"SlowEMA Length"
//channelLength=20 //"BB Channel Length"
//mult=2.0 //"BB Stdev Multiplier")
//deadZone=30 //"No trade zone threshold"

// indis
if barindex>slowLength then
 calcMACD = MACD[fastLength,slowLength,9](customclose)
 calcBBUpper = average[channelLength](customclose)+(mult*std[channelLength](customclose))
 calcBBLower = average[channelLength](customclose)-(mult*std[channelLength](customclose))

 t1 = (calcMACD-calcMACD[1])*sensitivity
 e1 = calcBBUpper - calcBBLower

 if t1>=0 then
  trendUP = t1
  trendDOWN = 0
 else
  trendUP = 0
  trendDOWN = -1*t1
 endif

 if trendUP<trendUP[1] then
  color = -1
 else
  color = 1
 endif

 if trendDOWN<trendDOWN[1] then
  color = -1
 else
  color = 1
 endif
endif

RETURN trendUP coloured by color as "UP", trendDOWN coloured by color as "DOWN", e1 as "Explosion line", deadzone*pipsize as "Dead Zone Line"
Comments
You must be logged in to post a comment.
Tu peux modifier le rendu des lignes en histogramme dans les paramètres de l'indicateur. Sinon, tu peux aussi modifier la dernière ligne avec ceci: RETURN trendUP style(histogram) coloured("green") as "UP", trendDOWN style(histogram) coloured("red") as "DOWN", e1 as "Explosion line", deadzone*pipsize as "Dead Zone Line"



Thanks Nicolas, this is a keeper!


merci beaucoup
merci c'est ce que j'ai fait.
un autre petit service,mon anglais étant médiocre,pourrait-tu m'expliquer le fonctionnement en français stp..je pense ne pas être le seul dans ce cas là malheureusement..
merci
PS : je remarque que l'explosion line ressemble étrangement aux bandwith que j'utilise dans un autre indicateur....
merci nicolas,
Mais je n'arrive pas a le faire fonctionner sur prorealtime cfd.
il ne reconnait pas '' by color"
si tu as une solution merci

bonjour nicolas
je n'ai pas le waddah attar comme sur ton impression d'ecran
j'ai paramétré les couleurs rouge et verte mais je n'ai pas d'histogramme comme toi uniquement des courbes à la place
merci de ton aide
stephane