

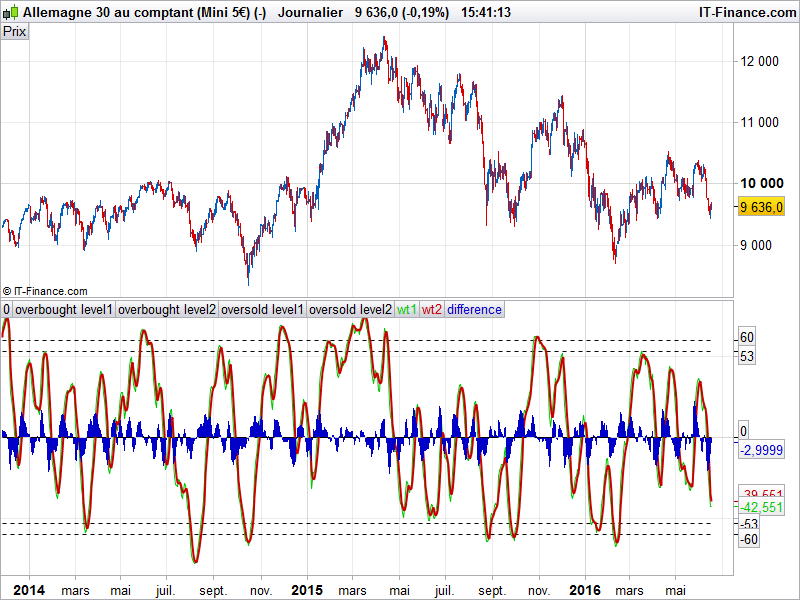
Wave Trend oscillator
June 17, 2016, 2:45 PM
Indicators
5 Comments
WaveTrend Oscillator is a port of a famous TS/MT indicator. More info: https://www.youtube.com/watch?v=7vhIsk51_Ro
When the oscillator is above the overbought band (red lines) and crosses down the signal (dotted line), it is usually a good SELL signal. Similarly, when the oscillator crosses above the signal when below the Oversold band (green lines), it is a good BUY signal.
//converted from pinescript indicator by request on forum : http://www.prorealcode.com/topic/new-prorealtime-indicator-wave-oscillator-by-lazybear/
(description above from TV).
n1 = 10 //Channel Length
n2 = 21 //Average Length
obLevel1 = 60 //Over Bought Level 1
obLevel2 = 53 //Over Bought Level 2
osLevel1 = -60 //Over Sold Level 1
osLevel2 = -53 //Over Sold Level 2

ap = medianprice
esa = exponentialaverage[n1](ap)
apesa = abs(ap - esa)
d = exponentialaverage[n1](apesa)
ci = (ap - esa) / (0.015 * d)
tci = exponentialaverage[n2](ci)

wt1 = tci
wt2 = average[4](wt1)

RETURN 0 as "0", oblevel1 as "overbought level1", oblevel2 as "overbought level2", oslevel1 as "oversold level1", oslevel2 as "oversold level2", wt1 coloured(0,200,0) as "wt1", wt2 coloured(200,0,0) as "wt2", wt1-wt2 coloured(0,0,200) as "difference"
Download
Filename:
PRC_WaveTrend-Oscillator.itf
Downloads:
432
Legend
I created ProRealCode because I believe in the power of shared knowledge. I spend my time coding new tools and helping members solve complex problems.
If you are stuck on a code or need a fresh perspective on a strategy, I am always willing to help. Welcome to the community!
Author’s Profile
Loading...