







WaveTrend Ribbon: Indicator to Detect Market Reversals
Introduction
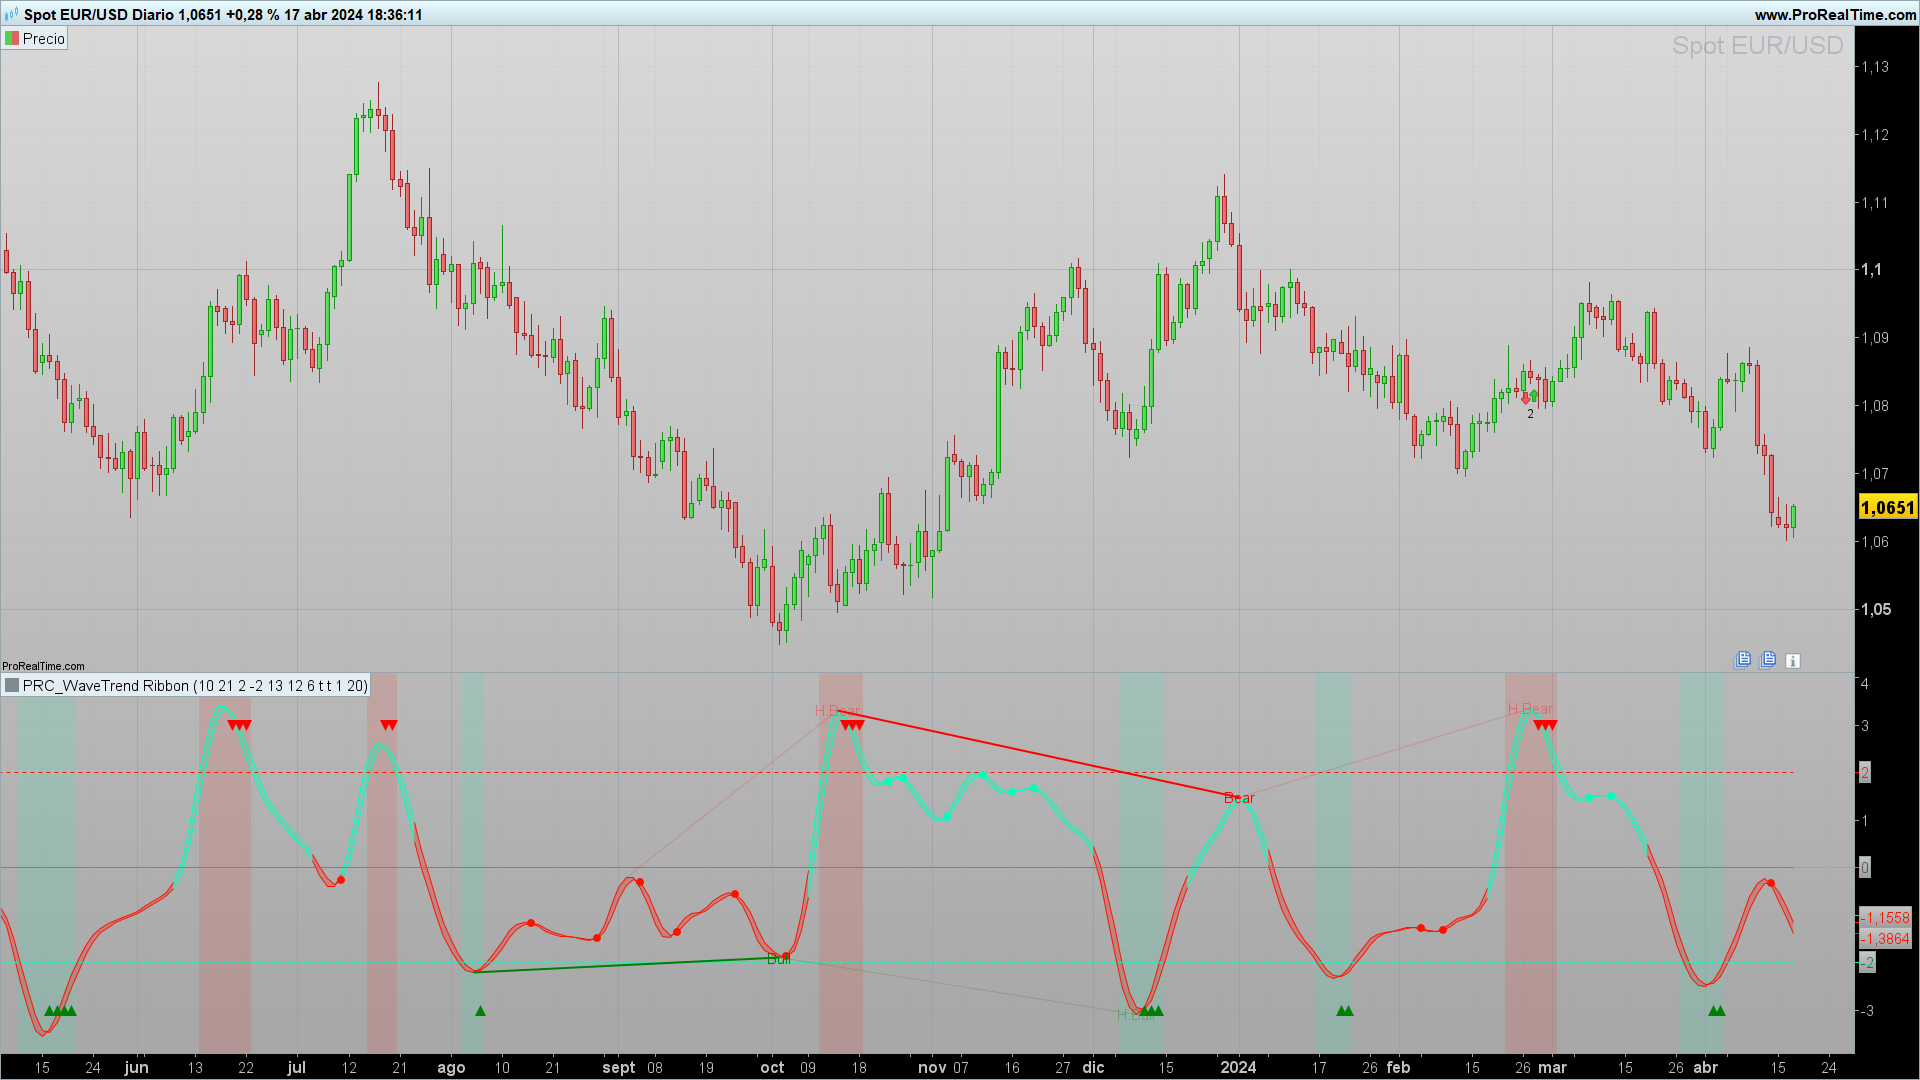
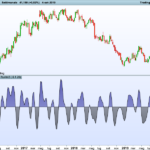
The “WaveTrend Ribbon” indicator allows the detection of critical overbought and oversold moments. This article delves into how this indicator works, how to set it up, and how to interpret its signals for more informed trading decisions.
Description of the Indicator
The “WaveTrend Ribbon” is a technical indicator that combines several analytical methods to provide a clear view of market trends and potential reversal points. Below, we break down its key components:
- Price Average (ap): Calculated as the average of the high, low, and closing prices.
- Esa and D: Esa (exponential average) smooths the price, and D (mean deviation) provides a measure of volatility.
- CI and TCI: CI (Inertia Channel) is a ratio between the current price and the Esa adjusted by D, while TCI (average of CI) smooths these values.
- Z-Score: Normalizes the TCI to determine how deviated the price is from the mean.
- High/Low Pivots: Uses the lbR and lbL parameters to detect local maximums and minimums, essential for identifying market turning points.
Visualization
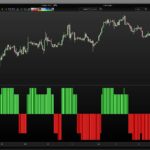
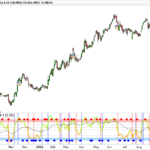
- Colors and Markers: The indicator changes color based on the Z-Score condition and marks overbought and oversold conditions to alert traders about potential entry or exit points.
Setting Up the Indicator
Configuring the “WaveTrend Ribbon” involves adjusting several parameters:
- Channel and average lengths (n1, n2)
- Overbought and oversold levels (oblevel, oslevel)
- Lengths for the calculation of the Z-Score and its smoothing (lengthZ, hmaLength, wmaLength)
Interpretation of Results
- Buy and Sell Signals: Signals are generated when the Z-Score crosses the established levels of overbought and oversold.
- Divergences: Identifying regular and hidden divergences provides a powerful signal of potential trend reversals.
Conclusion
The “WaveTrend Ribbon” is a versatile indicator that, when used correctly, can be a valuable tool in any trader’s arsenal.
Indicator Code
//-------------------------------------------------------------------------------//
//PRC_WaveTrend Ribbon
//version = 0
//17.04.24
//Iván González @ www.prorealcode.com
//Sharing ProRealTime knowledge
//-------------------------------------------------------------------------------//
//-----Inputs--------------------------------------------------------------------//
//-----WaveTrend
n1=10//Channel length
n2=21//Average length
oblevel=2//Overbought Z-score level
oslevel=-2//Oversold Z-score level
lengthZ=20//Length for Z-score Calculation
hmaLength=12//HMA Length for Z-score Smoothing
wmaLength=3//WMA Length for Z-Score
//-----Divergences
plotdivergences=1//show bullish and bearish divergences
plothiddendiv=1//show hidden bullish and bearish divergences
//-----Pivots
lbR=1//lookback Right
lbL=20//lookback Left
//-------------------------------------------------------------------------------//
//-----WaveTrend Calculation-----------------------------------------------------//
ap=(high+low+close)/3
esa=average[n1,1](ap)
d=average[n1,1](abs(ap-esa))
ci=(ap-esa)/(0.0015*d)
tci=average[n2,1](ci)
//-------------------------------------------------------------------------------//
//-----Z-Score Calculation-------------------------------------------------------//
meanWT=average[lengthZ](tci)
stdDevWT=std[lengthZ](tci)
zScoreaux=(tci-meanWT)/stdDevWT
zScore=hullaverage[hmaLength](zScoreaux)
zma=weightedaverage[wmaLength](zScore)
//-------------------------------------------------------------------------------//
//-----Colors--------------------------------------------------------------------//
if zScore > 0 then
r=0
g=255
b=187
else
r=255
g=17
b=0
endif
colorbetween(zScore,zma,r,g,b,70)
//-------------------------------------------------------------------------------//
//-----Overbought/Oversold conditions--------------------------------------------//
obCondition = zScore > obLevel
osCondition = zScore < osLevel
if obCondition then
backgroundcolor(255,17,0,30)
elsif osCondition then
backgroundcolor(0,255,187,30)
endif
if obCondition and zScore[1]>zScore then
drawtext("▼",barindex,3)coloured("red")
elsif osCondition and zScore[1]<zScore then
drawtext("▲",barindex,-3)coloured("green")
elsif zscore crosses over zma or zscore crosses under zma then
drawpoint(barindex,zma,2)coloured(r,g,b)
endif
//-------------------------------------------------------------------------------//
//-----Pivots High-Low Z-Score---------------------------------------------------//
osc=zScore
//-----pivots low
if osc > osc[lbR] and lowest[lbR](osc) > osc[lbR] and osc[lbR] < lowest[lbL](osc)[lbR+1] then
$pl[z+1] = osc[lbR]
$plx[z+1] = barindex[lbR]
$priceL[z+1] = low[lbR]
//drawpoint(barindex[lbR],osc[lbR],2)coloured("blue",50)
z = z + 1
endif
//-----pivots high
if osc < osc[lbR] and highest[lbR](osc)<osc[lbR] and osc[lbR]>highest[lbL](osc)[lbR+1] then
$ph[t+1]=osc[lbR]
$phx[t+1]=barindex[lbR]
$priceH[t+1]=high[lbR]
//drawpoint(barindex[lbR],osc[lbR],2)coloured("blue",50)
t=t+1
endif
//-------------------------------------------------------------------------------//
//-----Regular Bullish
oscHL = $pl[z] > $pl[max(0,z-1)] and $plx[max(0,z)] - $plx[max(0,z-1)]<=80
priceLL = low[lbR] < $priceL[max(0,z-1)]
bullCond = priceLL and oscHL and isset($pl[z])
//-----Hidden Bullish
oscLL = $pl[z] < $pl[max(0,z-1)] and $plx[max(0,z)] - $plx[max(0,z-1)]<=80
priceHL = low[lbR] > $priceL[max(0,z-1)]
hiddenbullCond = priceHL and oscLL and isset($pl[z])
//-----Regular Bearish
oscLH = $ph[t] < $ph[max(t-1,0)] and $phx[t] - $phx[max(0,t-1)]<=80
priceHH = high[lbR] > $priceH[max(0,t-1)]
bearCond = priceHH and oscLH and isset($ph[t])
//-----HiddenBearish
oscHH = $ph[t] > $ph[max(t-1,0)] and $phx[t] - $phx[max(0,t-1)]<=80
priceLH = high[lbR] < $priceH[max(0,t-1)]
hiddendbearCond = priceLH and oscHH and isset($ph[t])

if z<>z[1] and bullCond and plotdivergences then
drawsegment($plx[max(0,z-1)],$pl[max(0,z-1)],$plx[z],$pl[z])coloured("green")style(line,2)
drawtext("Bull",$plx[z],$pl[z]-tr)coloured("green")
elsif z<>z[1] and hiddenbullCond and plothiddendiv  then
drawsegment($plx[max(0,z-1)],$pl[max(0,z-1)],$plx[z],$pl[z])coloured("green",50)
drawtext("H.Bull",$plx[z],$pl[z]-tr)coloured("green",80)
elsif t<>t[1] and bearCond and plotdivergences then
drawsegment($phx[max(0,t-1)],$ph[max(0,t-1)],$phx[t],$ph[t])coloured("red")style(line,2)
drawtext("Bear",$phx[t],$ph[t]+tr)coloured("red")
elsif t<>t[1] and hiddendbearCond and plothiddendiv then
drawsegment($phx[max(0,t-1)],$ph[max(0,t-1)],$phx[t],$ph[t])coloured("red",50)
drawtext("H.Bear",$phx[t],$ph[t]+tr)coloured("red",80)
endif
//-------------------------------------------------------------------------------//
//-------------------------------------------------------------------------------//
return zScore as "Z-Score"coloured(r,g,b)style(line,1),zma as "Avg Z-Score"coloured(r,g,b)style(line,1),0 as "0" coloured("gray"),obLevel as "Overbought"coloured(255,17,0)style(dottedline),osLevel as "Overshold"coloured(0,255,187)style(dottedline)
Comments
You must be logged in to post a comment.

Great tool again and great job, thank you! So from what I see everytime Z-Score is over 0 means that you have a positive trend (no matter if Z-score is going down because the important thing is Zscore being over 0). But here there is the issue. How would you filter out those many irrelevant trends and try to find a good powerful trend? What indicators (because there are too many and they also give contradictory results one from another) do you recommend to filter out irrelevant trends?


Hello Ivan, thanks a lot for all these beautiful and useful indicator!! Great Job!!

It might be the most powerful tool you have shared. Congratulations.
hi ivan I have logged this last week if when you get a chance if this can be converted please https://www.prorealcode.com/topic/this-elliott-wave-trading-view-indicator-to-pro-real-time-please/ many thanks