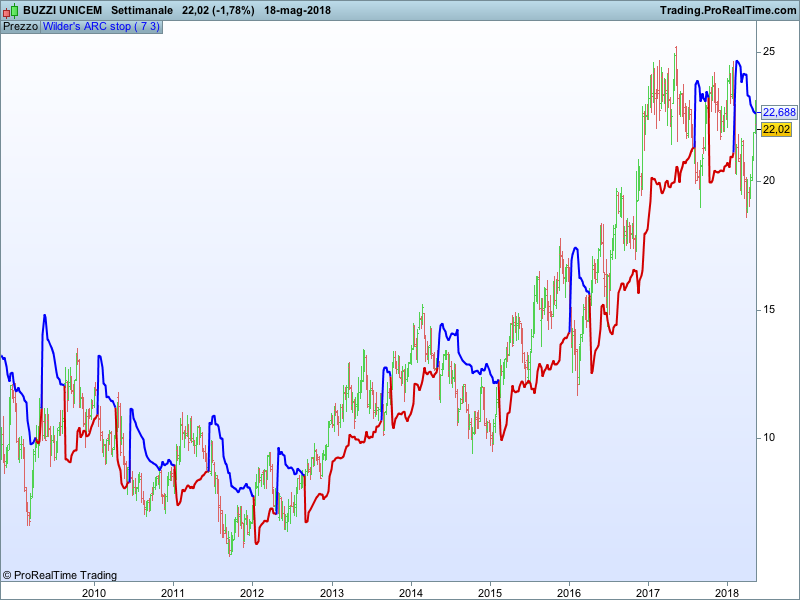
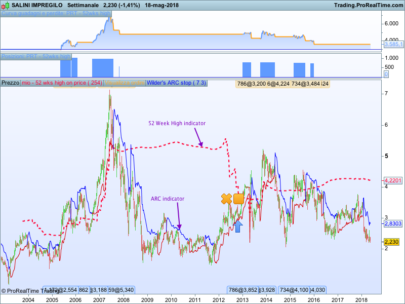
This Stop and Reverse indicator (SAR) has been created by Welles Wilder. You can find many versions and variations of it (also the more famous 3 bar stop used by Larry Williams is based on this indicator) but this is the original coding of it.
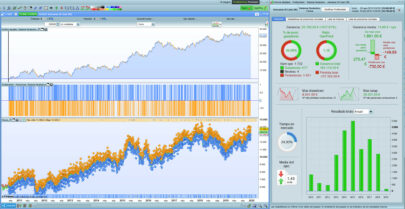
I backtested this code and it also provide some SMALL but consistent income (unlike for example the 3 bar stop).
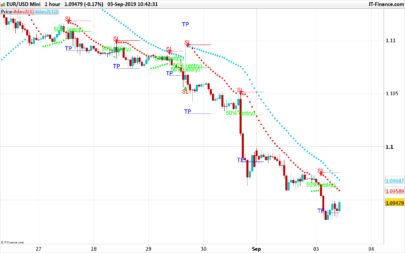
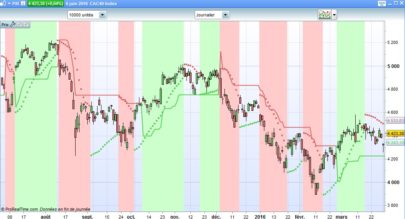
Rules are simple: when the price is above the SAR you remain long, when crosses below you close your long position (and you can short if you want).
Blue skies!!
|
1 2 3 4 5 6 7 8 9 10 11 12 13 14 15 16 17 18 19 20 21 22 23 24 25 26 27 28 29 30 31 32 33 34 35 36 37 38 39 40 41 42 43 44 45 46 47 48 49 50 51 |
//period=7 //coeff=3 mioATR=AverageTrueRange[period](close) arc=coeff*mioATR[1] once ref=open if barindex=8 then if close>=close[1] then ref=close mioSAR=close-arc elsif close<close[1] then ref=close mioSAR=close+arc endif inv=barindex[1] endif if barindex>8 then if close crosses under mioSAR then mioSAR=close+arc inv=barindex endif if close crosses over mioSAR then mioSAR=close-arc inv=barindex endif if close>=mioSAR and (barindex-inv)>0 then ref=highest[barindex-inv](close[1]) mioSAR=ref-arc endif if close<mioSAR and (barindex-inv)>0 then ref=lowest[barindex-inv](close[1]) mioSAR=ref+arc endif endif if close>mioSAR then red=210 blu=0 else red=0 blu=250 endif return mioSAR coloured (red,0,blu) as "Wilder's ARC stop" |
Share this
No information on this site is investment advice or a solicitation to buy or sell any financial instrument. Past performance is not indicative of future results. Trading may expose you to risk of loss greater than your deposits and is only suitable for experienced investors who have sufficient financial means to bear such risk.
ProRealTime ITF files and other attachments :PRC is also on YouTube, subscribe to our channel for exclusive content and tutorials

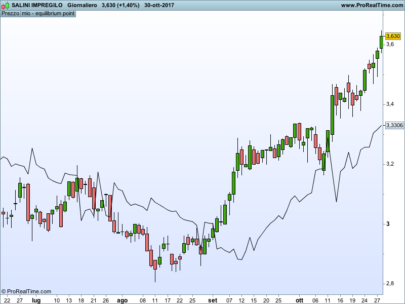
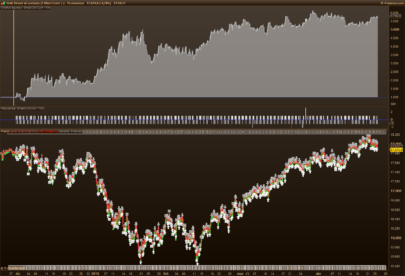


It is possible to apply this indicator ON the chart , because when I try to apply the formula is plotted below the chart (like the RSI for example). Thank you!
Yes, just apply it on the price chart by using the wrench on the left upper side of your price chart.
Hi Nicolas, thanks for the reply, I managed to apply the indicator on the chart.