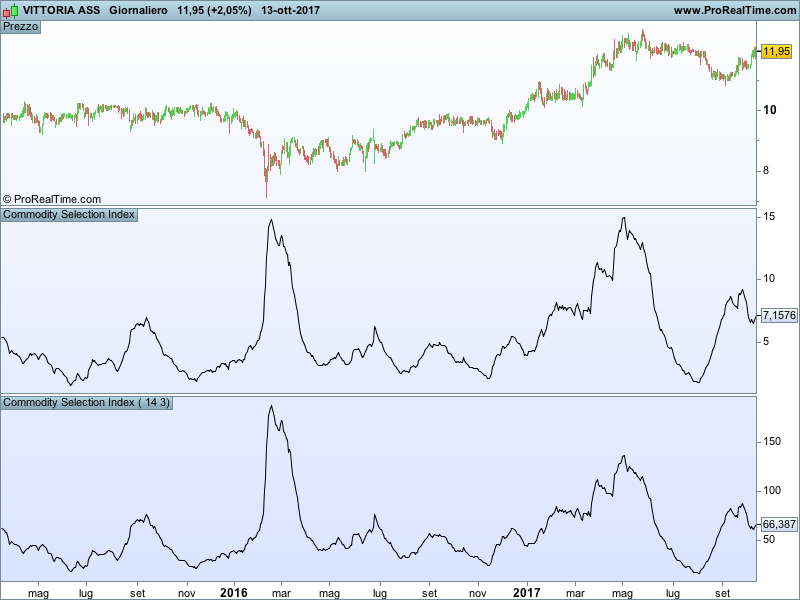
Welles Wilder introduced the CSI (Commodity Selection Index) in his bestseller “New concepts in technical trading” and uses this indicator to screen the commodities that are “strong” enough to be traded with a trend following system. The bigger the CSI the stronger the trend.
The index created originally by Wilder though is made for commodities and is not reliable for stocks. I tried to upgrade this indicator also for stocks by changing a little the formula and by redesigning the ATR formula.
I am attaching the original version and the modified version.
Blue skies!!
Code for commodities
|
1 2 3 4 5 6 7 8 9 10 11 12 |
Leverage=50 Margin=1000 Commissions=20 fact1=Leverage/(sqrt(Margin)) fact2=1/(150+Commissions) csi=ADXR[14]*AverageTrueRange[14](close)*fact1*fact2*100 return csi as "Commodity Selection Index" |
Code for stocks
|
1 2 3 4 5 6 7 8 9 10 11 12 13 14 15 |
//period=14 //MM=3 a=range/close[1] b=abs(high-close[1])/close[1] c=abs(low-close[1])/close[1] TRbalanced=100*max(a,max(b,c)) ATRbalanced=Average[period,MM](trbalanced) csi=ADXR[14]*atrbalanced return csi as "Commodity Selection Index" |
Share this
No information on this site is investment advice or a solicitation to buy or sell any financial instrument. Past performance is not indicative of future results. Trading may expose you to risk of loss greater than your deposits and is only suitable for experienced investors who have sufficient financial means to bear such risk.
ProRealTime ITF files and other attachments :PRC is also on YouTube, subscribe to our channel for exclusive content and tutorials

Hi. I want Indicator Reversal Bars. I look in the library without seeing. hope the helping. Thank you !