Wing’s Trend Line Bands – (Support and Resistance)
This is an unconventional indicator I have created in PRT 10.2. I have not seen anything similar.
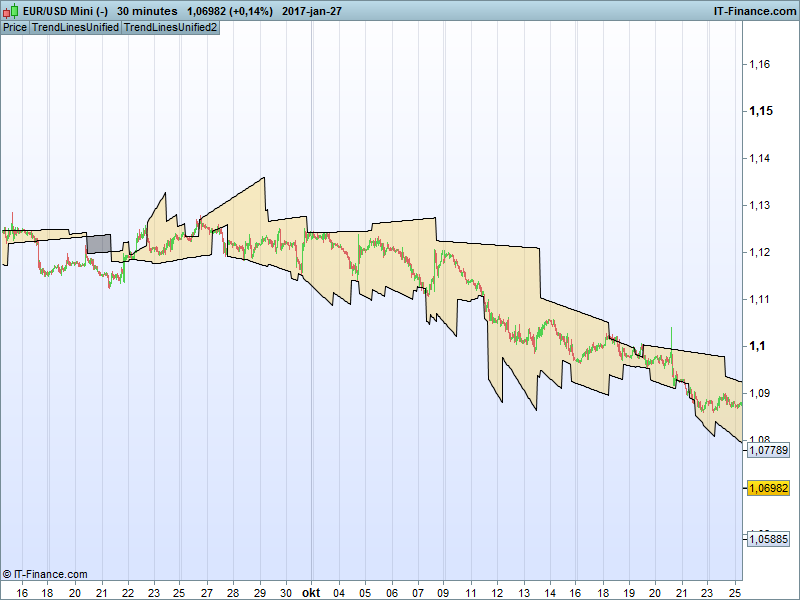
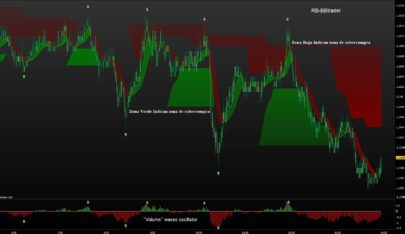
It calculates twelve different trend lines, six that resemble levels of support and six that resemble levels of resistance. They are then averaged into two trend lines, to form a band around the price. The ‘band’ does not behave like for example a bollinger band. Trend Line Bands are more dynamic since they are drawn between different high/low points, and are therefore, straight.
How to trade:
Appropriate timeframe, security and system is for you to find. Remember that this indicator is experimental and can be developed in many ways. Trend Line Bands can be traded in at least three ways that I have found:
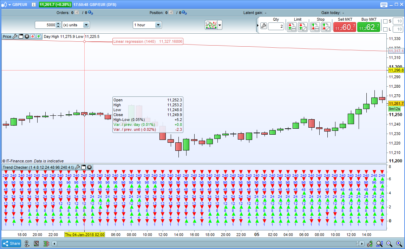
- Mean reversion (price bouncing on the bands)
- Breakout (decisive move through a band)
- Band convergence (The algorithm can output a line of support ABOVE the line of resistance. This is a sign of upcoming trend reversal and should not be traded in the ways mentioned above.)
123456789101112131415161718192021222324252627282930313233343536373839404142434445464748495051525354555657585960616263646566676869707172737475767778798081828384858687888990919293949596979899100101102103104105106107108109110111112113114115116117118119120121122123124125126127128129130131132133134135136137138//////////////////////////////////////////////////////// Wing's Trend Line Bands - (Support and Resistance)//// Made by user "Wing" of ProRealCode.com// https://www.prorealcode.com/user/wing///////////////////////////////////////////////////////// Parameter:p = 7//////////////////////////////////////////////////rs=RSI[p]once t1=0once t2=0once t3=0once t4=0once b1=0once b2=0once b3=0once b4=0once top=0if rs[4]>70 and high[4]>high[3] and high[4]>high[2] and high[4]>high[1] and high[4]>high and top=0 thent4=t3t3=t2t2=t1t1=barindex-4top=6endifif rs[4]<30 and low[4]<low[3] and low[4]<low[2] and low[4]<low[1] and low[4]<low and top=0 thenb4=b3b3=b2b2=b1b1=barindex-4top=6endifif top>0 thentop=top-1endif// topsif high[barindex-t2]>high[barindex-t1] thenlinet1=high[barindex-t2]-(((barindex-t2)*sqrt(square(high[barindex-t1]-high[barindex-t2])))/(t1-t2))elselinet1=high[barindex-t2]+(((barindex-t2)*sqrt(square(high[barindex-t1]-high[barindex-t2])))/(t1-t2))endifif high[barindex-t3]>high[barindex-t2] thenlinet2=high[barindex-t3]-(((barindex-t3)*sqrt(square(high[barindex-t2]-high[barindex-t3])))/(t2-t3))elselinet2=high[barindex-t3]+(((barindex-t3)*sqrt(square(high[barindex-t2]-high[barindex-t3])))/(t2-t3))endifif high[barindex-t3]>high[barindex-t1] thenlinet21=high[barindex-t3]-(((barindex-t3)*sqrt(square(high[barindex-t1]-high[barindex-t3])))/(t1-t3))elselinet21=high[barindex-t3]+(((barindex-t3)*sqrt(square(high[barindex-t1]-high[barindex-t3])))/(t1-t3))endifif high[barindex-t4]>high[barindex-t1] thenlinet3=high[barindex-t4]-(((barindex-t4)*sqrt(square(high[barindex-t1]-high[barindex-t4])))/(t1-t4))elselinet3=high[barindex-t4]+(((barindex-t4)*sqrt(square(high[barindex-t1]-high[barindex-t4])))/(t1-t4))endifif high[barindex-t4]>high[barindex-t2] thenlinet31=high[barindex-t4]-(((barindex-t4)*sqrt(square(high[barindex-t2]-high[barindex-t4])))/(t2-t4))elselinet31=high[barindex-t4]+(((barindex-t4)*sqrt(square(high[barindex-t2]-high[barindex-t4])))/(t2-t4))endifif high[barindex-t4]>high[barindex-t3] thenlinet32=high[barindex-t4]-(((barindex-t4)*sqrt(square(high[barindex-t3]-high[barindex-t4])))/(t3-t4))elselinet32=high[barindex-t4]+(((barindex-t4)*sqrt(square(high[barindex-t3]-high[barindex-t4])))/(t3-t4))endif// botsif low[barindex-b2]>low[barindex-b1] thenlineb1=low[barindex-b2]-(((barindex-t2)*sqrt(square(low[barindex-b1]-low[barindex-b2])))/(b1-b2))elselineb1=low[barindex-b2]+(((barindex-b2)*sqrt(square(low[barindex-b1]-low[barindex-b2])))/(b1-b2))endifif low[barindex-b3]>low[barindex-b2] thenlineb2=low[barindex-b3]-(((barindex-b3)*sqrt(square(low[barindex-b2]-low[barindex-b3])))/(b2-b3))elselineb2=low[barindex-b3]+(((barindex-b3)*sqrt(square(low[barindex-b2]-low[barindex-b3])))/(b2-b3))endifif low[barindex-b3]>low[barindex-b1] thenlineb21=low[barindex-b3]-(((barindex-b3)*sqrt(square(low[barindex-b1]-low[barindex-b3])))/(b1-b3))elselineb21=low[barindex-b3]+(((barindex-b3)*sqrt(square(low[barindex-b1]-low[barindex-b3])))/(b1-b3))endifif low[barindex-b4]>low[barindex-b1] thenlineb3=low[barindex-b4]-(((barindex-b4)*sqrt(square(low[barindex-b1]-low[barindex-b4])))/(b1-b4))elselineb3=low[barindex-b4]+(((barindex-b4)*sqrt(square(low[barindex-b1]-low[barindex-b4])))/(b1-b4))endifif low[barindex-b4]>low[barindex-b2] thenlineb31=low[barindex-b4]-(((barindex-b4)*sqrt(square(low[barindex-b2]-low[barindex-b4])))/(b2-b4))elselineb31=low[barindex-b4]+(((barindex-b4)*sqrt(square(low[barindex-b2]-low[barindex-b4])))/(b2-b4))endifif low[barindex-b4]>low[barindex-b3] thenlineb32=low[barindex-b4]-(((barindex-b4)*sqrt(square(low[barindex-b3]-low[barindex-b4])))/(b3-b4))elselineb32=low[barindex-b4]+(((barindex-b4)*sqrt(square(low[barindex-b3]-low[barindex-b4])))/(b3-b4))endif// return valuesresistance=(linet1+ linet2+ linet21+ linet3+ linet31+ linet32)/6support=(lineb1+ lineb2+ lineb21+ lineb3+ lineb31+ lineb32)/6midpoint=(resistance+support)/2return resistance, support, midpoint
Share this
No information on this site is investment advice or a solicitation to buy or sell any financial instrument. Past performance is not indicative of future results. Trading may expose you to risk of loss greater than your deposits and is only suitable for experienced investors who have sufficient financial means to bear such risk.
ProRealTime ITF files and other attachments :
Find other exclusive trading pro-tools on ![]()
PRC is also on YouTube, subscribe to our channel for exclusive content and tutorials


Hello Wing, nice to see your name into the Library too 🙂 I appreciate your help on forums!
I need to investigate more into your interesting indicator, I think I might need some time to perfectly understand the concept behind its code. Thanks for the contribution, I’m looking forward for more interesting things from your own research 🙂
Yes, investigate as much as you want. For more insight, you can view the linet1, linet2 etc. individually on the chart. That will show you exactly what trend lines are found and used for the bands.
Hi Wing,
Thanks for your sharing. I am still trying to breakdown & understand your code.
For your example above, 30m chart & Parameter = 7. Does it mean this indicator analysze the Support & Resistance for the last 7 candles? (e.g. 4 hours?)
Br, CKW
Hello CKW.
No, the parameter, 7 in this case, is used when calling the RSI indicator to identify points of interests. It is between these these points that the trend lines are drawn. There are 8 points in total on which the lines are based, and when a new point is found, the oldest previous point is discarded. New points are found only when the RSI[7] hits an extreme low or high, so the distance between points will vary. If you increase the parameter from 7 to 9 for example, you will experience trend lines that are based on more long-term trends.