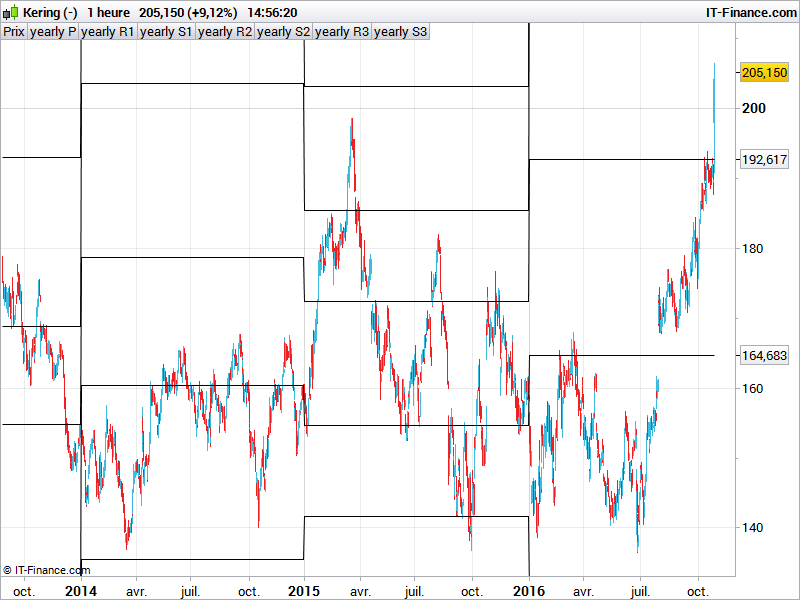
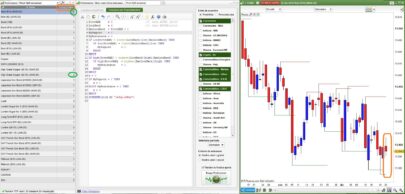
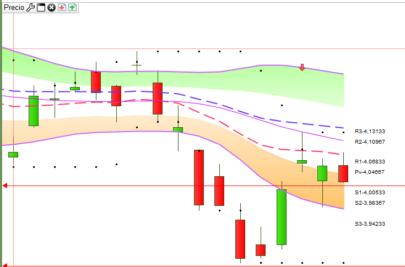
Here is an annual pivot points indicator that complete the whole series of pivot points indis that can be found in our prorealtime code library. Like the other ones, this one embed 3 different kind of calculation that can be changed at will with the variable “mode” available at line 8 of the code.
To compute correctly, the indicator need sufficient amount of data, especially on intraday timeframe.
coded by request on the French forums.
|
1 2 3 4 5 6 7 8 9 10 11 12 13 14 15 16 17 18 19 20 21 22 23 24 25 26 27 28 29 30 31 32 |
//PRC_YearlyPivotPoints | indicator //26.10.2016 //Nicolas @ www.prorealcode.com //Sharing ProRealTime knowledge //adapted from PRT original indicator //select mode of calculation of the yearly pivot points (0,1,2) mode = 0 If Year<>Year[1] then yearlyHigh = Highest[BarIndex - lastYearBarIndex](High)[1] yearlyLow = Lowest[BarIndex - lastYearBarIndex](Low)[1] lastYearBarIndex = BarIndex If mode = 0 then yearlyPivot = (yearlyHigh + yearlyLow + Close[1]) / 3 Elsif mode = 1 then yearlyPivot = (Open + yearlyHigh + yearlyLow + Close[1]) / 4 Elsif mode = 2 then yearlyPivot = (yearlyHigh + yearlyLow + Close[1]*2) / 4 Else yearlyPivot = (Open*2 + yearlyHigh + yearlyLow) / 4 Endif yearlyR1 = 2*yearlyPivot - yearlyLow yearlyS1 = 2*yearlyPivot - yearlyHigh yearlyR2 = yearlyPivot + (yearlyHigh - yearlyLow) yearlyS2 = yearlyPivot - (yearlyHigh - yearlyLow) yearlyR3 = yearlyR1 + (yearlyHigh - yearlyLow) yearlyS3 = yearlyS1 - (yearlyHigh - yearlyLow) Endif return yearlyPivot as "yearly P", yearlyR1 as "yearly R1", yearlyS1 as "yearly S1", yearlyR2 as "yearly R2", yearlyS2 as "yearly S2", yearlyR3 as "yearly R3", yearlyS3 as "yearly S3" |
Share this
No information on this site is investment advice or a solicitation to buy or sell any financial instrument. Past performance is not indicative of future results. Trading may expose you to risk of loss greater than your deposits and is only suitable for experienced investors who have sufficient financial means to bear such risk.
ProRealTime ITF files and other attachments :PRC is also on YouTube, subscribe to our channel for exclusive content and tutorials



Merci beaucoup pour ce code .
C’est parfait pour prendre position et pour les take profit sur le long terme .
bonsoir
j’ai tenté de déterminer le point pivot trimestriel en mettant quarter mais cela n’est pas reconnu. Y aurait-il une solution mais étant mauvais en codage j’ai bien cherché dans le forum, je n’ai rien trouvé pour cette période de trimestre. par avance merci de votre aide.
Cela a déjà été codé quelque part sur le forum, en anglais, il faut chercher ‘quarterly’ avec l’outil de recherche du site.
dans cet article par exemple “Monthly High Low Close Indicator”. N’avait pas cherché au bon endroit et avait pensé trop simple avec quarter. merci
quan t’on ajoute, le code …. PRT error in code
Tu as peut être fait un mauvais copier/coller. Le mieux étant de télécharger le code de l’indicateur et de l’importer dans la plateforme.
Encore une fois, j’ai importé le fichier, mais malheureusement cela ne fonctionne pas, j’ajoute une capture d’écran de l’erreur.
salutations
link …. https://prnt.sc/seo15l
https://prnt.sc/seo15l
Yes I can’t get this to work either
Bonjour Nicolas, seriez-vous en mesure de nous conseiller sur la façon d’identifier un point de pivot annuel dans le pro screener?
Merci
Pete
Génial merci Nicolas. Il est facile d’ajouter les niveau S/R 4 et 5 ? avec la purge cette année, on voit que certains indices sont allés les chercher (ESP35, etc. )
Oui c’est facile
Merci Nicolas, j’utilisais avec bonheur ce code dans la 10.3, il ne tourne plus dans la v11. Je suppose que quelqu’un a déjà cherché à le mettre à jour ?
Remplacer les lignes 11 et par 12 avec:
yearlyHigh = Highest[max(1,BarIndex – lastYearBarIndex)](High)[1]
yearlyLow = Lowest[max(1,BarIndex – lastYearBarIndex)](Low)[1]
merci !!!