

ZERO LAG TEMA: An Advanced Approach to Reducing Trend Detection Lag
Introduction
The ZERO LAG TEMA indicator is an advanced technical analysis tool that combines Exponential Moving Averages (EMA) and Triple Exponential Moving Averages (TEMA) to provide precise trading signals and minimize lag in detecting trend changes. This indicator is especially useful for traders seeking to identify early trend changes and optimize their entry and exit strategies.
Indicator Components
The ZERO LAG TEMA is based on two sets of Exponential Moving Averages: one with a fast period and the other with a slow period. The input parameters allow adjusting these periods to fit different timeframes and trading styles.
– src: Custom close price (customclose).
– inpPeriodFast: Fast period for the fast TEMA (default 22).
– inpPeriodSlow: Slow period for the slow TEMA (default 144).
– showsigs: Show signals on the chart (1 to show, 0 to hide).
– colorbars: Color the chart bars based on the TEMA conditions (1 to color, 0 not to color).
Indicator Calculation
Fast TEMA
To calculate the fast TEMA, three Exponential Moving Averages are applied sequentially:
ema1f = average[inpPeriodFast,1](src)
ema2f = average[inpPeriodFast,1](ema1f)
ema3f = average[inpPeriodFast,1](ema2f)
outf = 3 * (ema1f - ema2f) + ema3f

ema1af = average[inpPeriodFast,1](outf)
ema2af = average[inpPeriodFast,1](ema1af)
ema3af = average[inpPeriodFast,1](ema2af)

temafast = 3 * (ema1af - ema2af) + ema3af
Slow TEMA
Similarly, the slow TEMA is calculated using a longer period:
ema1 = average[inpPeriodSlow,1](src)
ema2 = average[inpPeriodSlow,1](ema1)
ema3 = average[inpPeriodSlow,1](ema2)
out = 3 * (ema1 - ema2) + ema3

ema1a = average[inpPeriodSlow,1](out)
ema2a = average[inpPeriodSlow,1](ema1a)
ema3a = average[inpPeriodSlow,1](ema2a)

temaslow = 3 * (ema1a - ema2a) + ema3a
Theory of Exponential Moving Averages and TEMA
Exponential Moving Average (EMA)
The Exponential Moving Average (EMA) is a variant of the simple moving average that gives more weight to recent data. This allows the EMA to respond more quickly to price changes. The EMA formula is as follows:
\[ \text{EMA}_t = (\text{Price}_t \times \alpha) + (\text{EMA}_{t-1} \times (1 – \alpha)) \]
Where:
– \( \text{EMA}_t \) is the current EMA value.
– \( \text{Price}_t \) is the current price.
– \( \alpha \) is the smoothing factor, calculated as \( \frac{2}{n + 1} \), where \( n \) is the EMA period.
Triple Exponential Moving Average (TEMA)
The Triple Exponential Moving Average (TEMA) is an advanced moving average that seeks to reduce the lag observed in simple and exponential moving averages. TEMA was introduced by Patrick Mulloy in 1994 and is calculated using three EMAs, making it more responsive to price changes, eliminating market noise, and providing clearer signals.
The TEMA formula is:
\[ \text{TEMA} = 3 \times \text{EMA1} – 3 \times \text{EMA2} + \text{EMA3} \]
Where:
– \( \text{EMA1} \), \( \text{EMA2} \), and \( \text{EMA3} \) are sequentially calculated exponential moving averages.
Advantages of Using TEMA
– **Lag Reduction**: TEMA offers a faster response to price changes compared to simple and exponential moving averages.
– **Greater Precision**: By using three layers of exponential smoothing, TEMA better eliminates market noise, providing more accurate signals.
– **Improved Trading Signals**: TEMA is ideal for traders looking to identify early trend changes and react promptly.
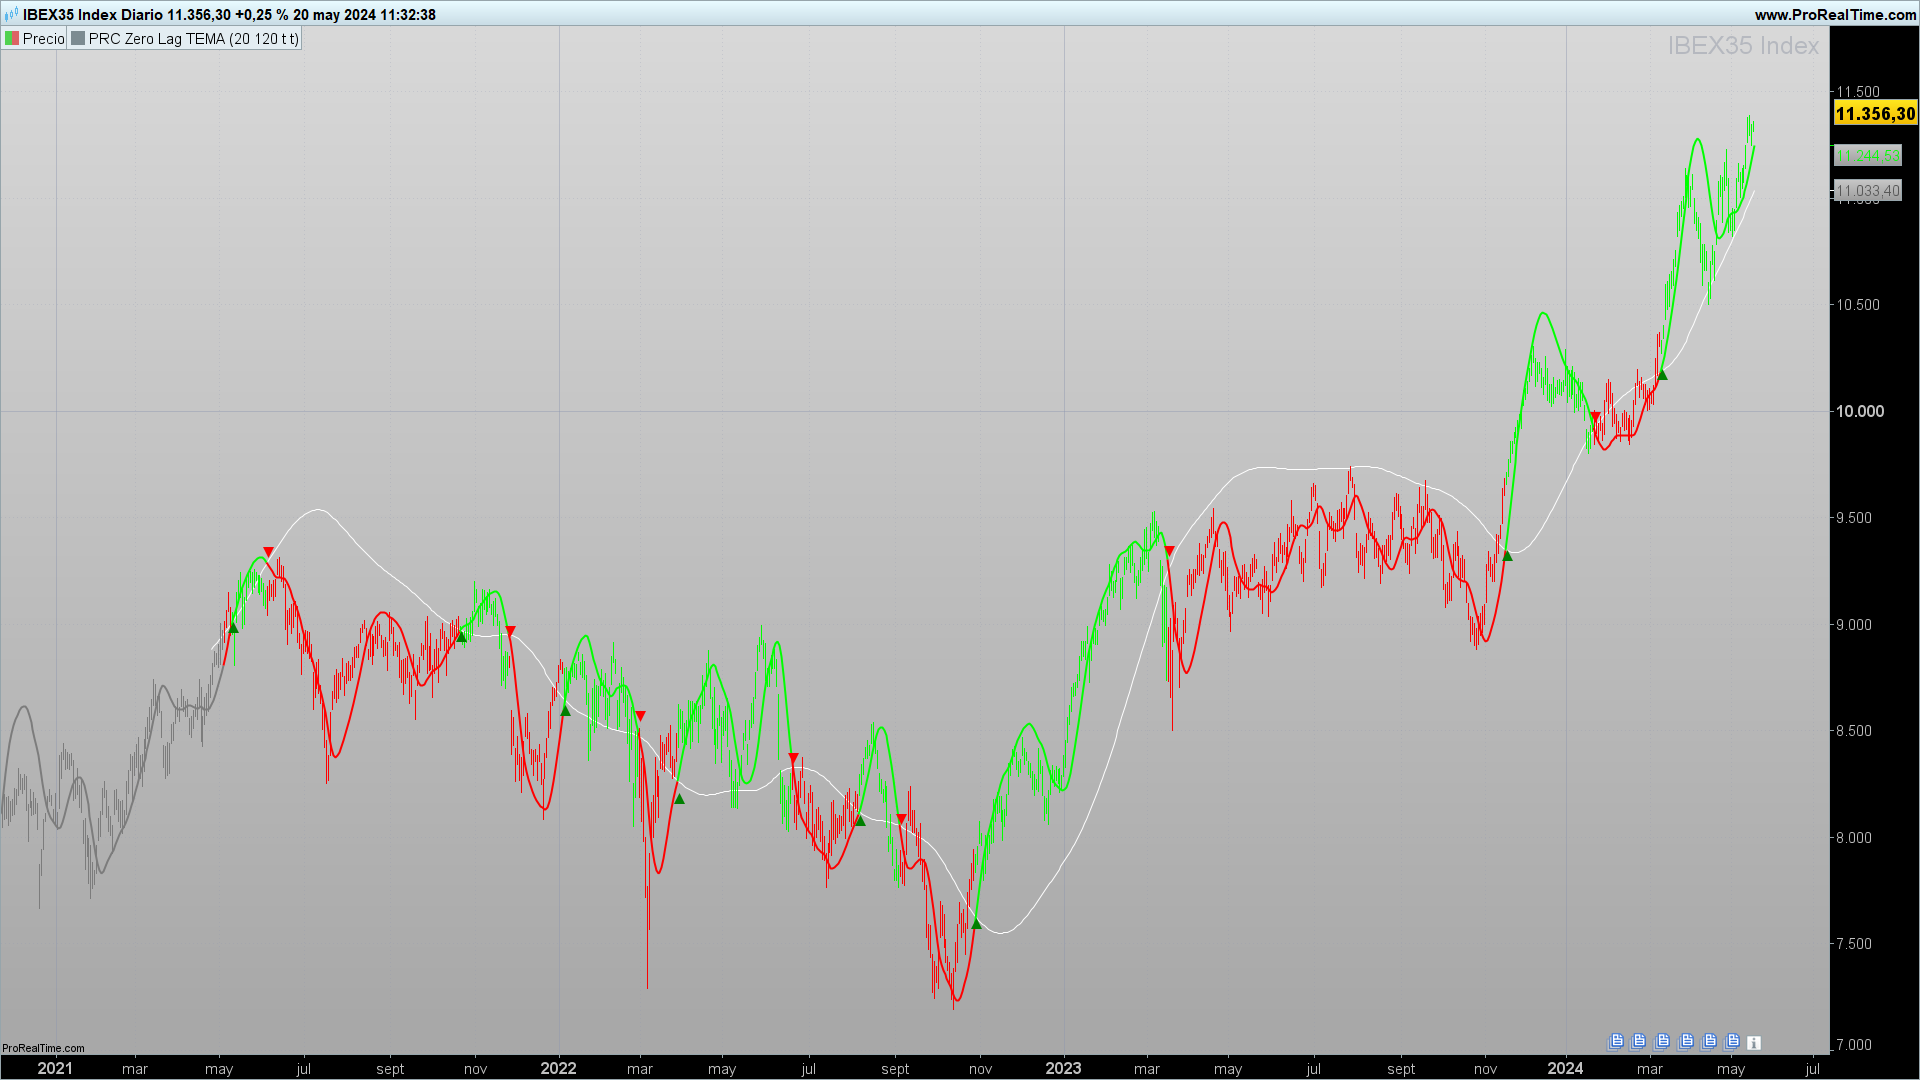
Trading Signals
The indicator generates buy and sell signals based on the crossovers between the fast TEMA and the slow TEMA:
golong = temafast crosses over temaslow
goshort = temafast crosses under temaslow

if showsigs and golong then
drawtext("▲", barindex, temaslow - 0.3 * tr) coloured("green")
elsif showsigs and goshort then
drawtext("▼", barindex, temaslow + 0.3 * tr) coloured("red")
endif
Bar Coloring
The indicator can also color the chart bars to visually highlight market conditions:
if temafast > temaslow then
r = 0
g = 255
b = 0
else
r = 255
g = 0
b = 0
endif

if colorbars then
DRAWCANDLE(open, high, low, close) coloured(r, g, b)
endif
Complete Code in ProBuilder
Below is the complete code for the ZERO LAG TEMA indicator in ProBuilder language:
//PRC_ZERO LAG TEMA
//version = 0
//05.03.24
//Iván González @ www.prorealcode.com
//Sharing ProRealTime knowledge
///inputs
src = customclose
inpPeriodFast=20 //Fast Period
inpPeriodSlow=120 //Slow Period
showsigs=1 //Show signals
colorbars=1 //Color Bars
////Zlagtema : temafast
ema1f = average[inpPeriodFast,1](src)
ema2f = average[inpPeriodFast,1](ema1f)
ema3f = average[inpPeriodFast,1](ema2f)
outf = 3*(ema1f-ema2f)+ema3f
ema1af = average[inpPeriodFast,1](outf)
ema2af = average[inpPeriodFast,1](ema1af)
ema3af = average[inpPeriodFast,1](ema2af)

temafast = 3*(ema1af-ema2af)+ema3af
////Zlagtema : temaslow
ema1 = average[inpPeriodSlow,1](src)
ema2 = average[inpPeriodSlow,1](ema1)
ema3 = average[inpPeriodSlow,1](ema2)
out = 3*(ema1-ema2)+ema3
ema1a = average[inpPeriodSlow,1](out)
ema2a = average[inpPeriodSlow,1](ema1a)
ema3a = average[inpPeriodSlow,1](ema2a)

temaslow = 3*(ema1a-ema2a)+ema3a

///DEFINE COLOR
if barindex<=inpPeriodSlow*6 then
r=124
g=124
b=124
else
if temafast > temaslow then
r=0
g=255
b=0
else
r=255
g=0
b=0
endif
endif

///plot signals
golong = temafast crosses over temaslow
goshort = temafast crosses under temaslow

if showsigs and golong then
drawtext("▲",barindex,temaslow-0.3*tr)coloured("green")
elsif showsigs and goshort then
drawtext("▼",barindex,temaslow+0.3*tr)coloured("red")
endif

///Color bars
if colorbars then
DRAWCANDLE(open, high, low, close)coloured(r,g,b)
endif

return temaslow as "TEMA Slow" coloured("White")style(line,1), temafast as "TEMA Fast"coloured(r,g,b)style(line,2)
