
1. Introduction
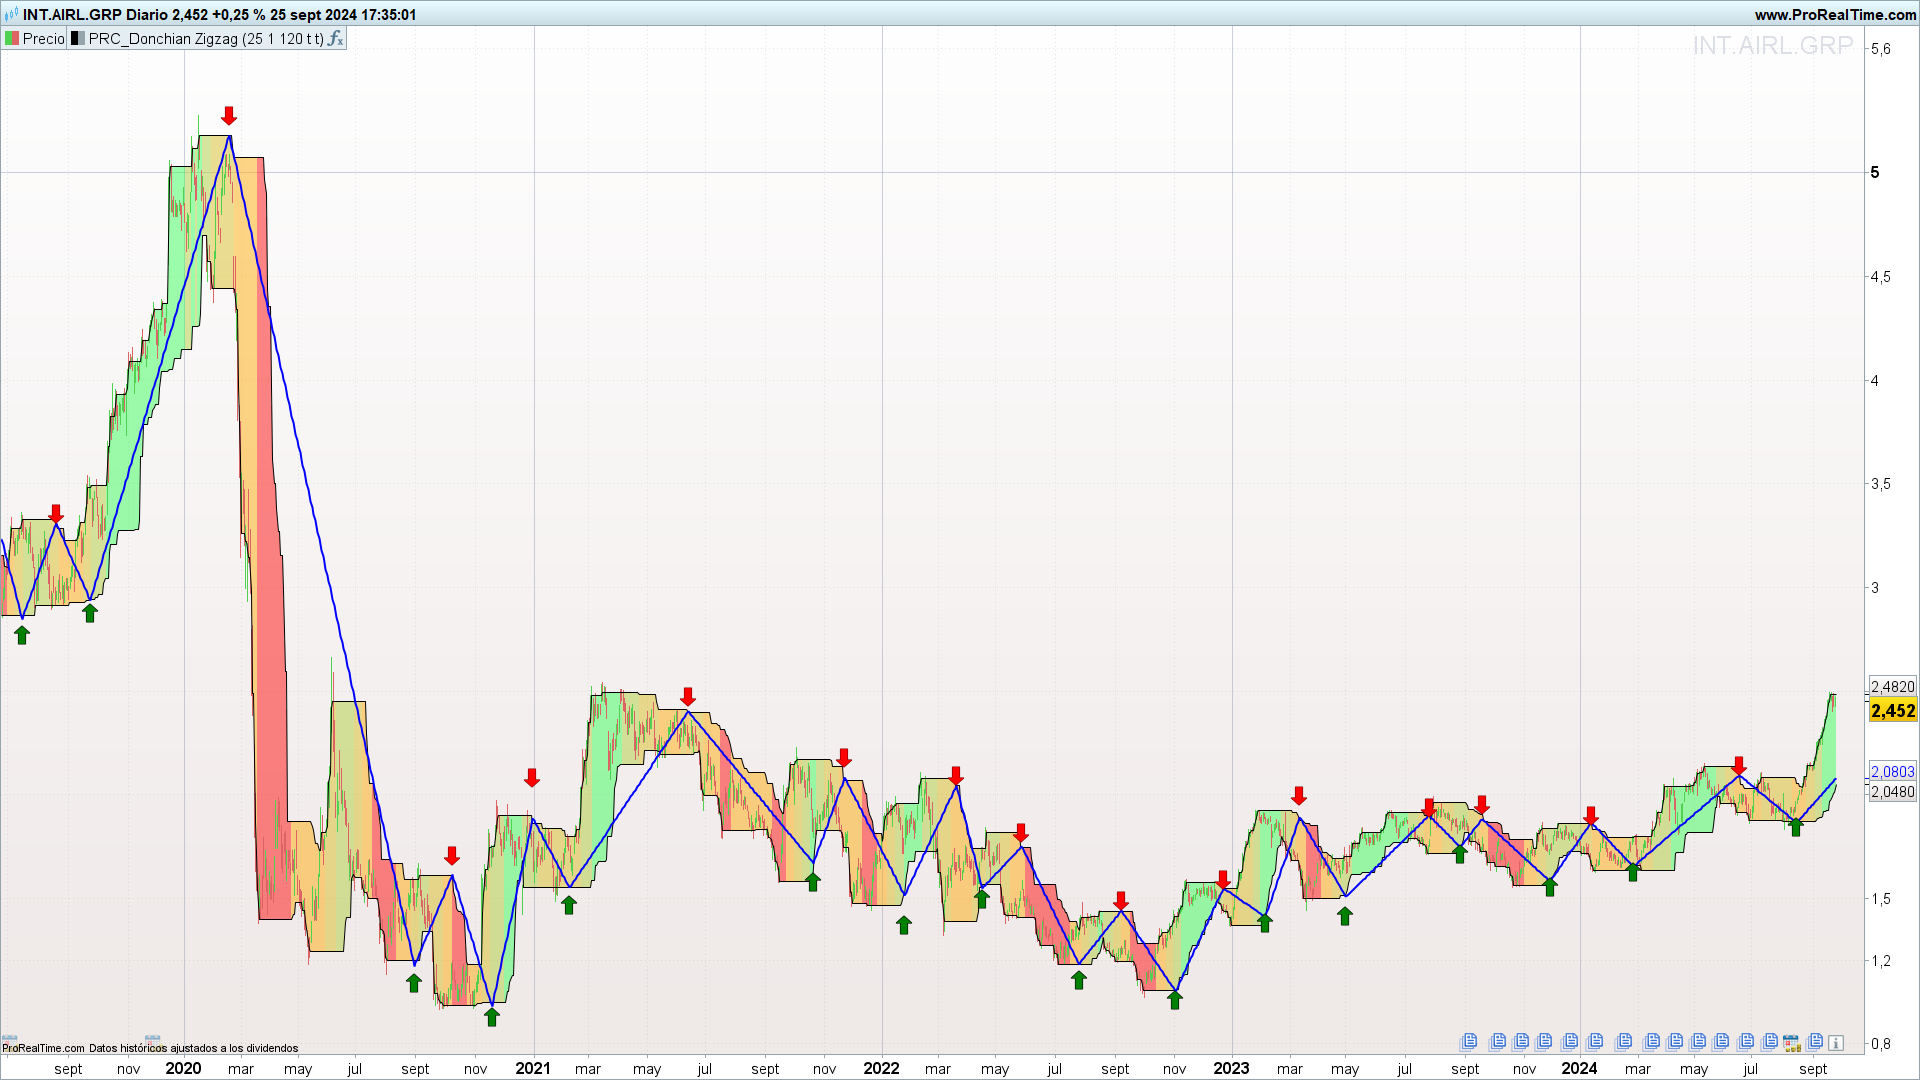
The Zig-Zag Donchian indicator is a technical analysis tool that combines the logic of the Zig-Zag with Donchian channels to identify turning points in the price direction of an asset. This indicator is especially useful for traders looking to detect emerging trends, local highs and lows, as well as potential buy and sell signals.
The Zig-Zag Donchian is based on the concept of identifying the most significant price movements, filtering out market noise, and highlighting meaningful changes. Unlike the traditional Zig-Zag indicator, which focuses solely on price pivots, the Zig-Zag Donchian uses Donchian channels to establish upper and lower boundaries that help validate trend changes. This allows traders to gain a clearer view of market dynamics and make informed decisions based on the interaction of price with these bands.
This indicator adapts well to different financial assets, and its customization options allow it to be adjusted to the specific characteristics of the market in which it is being used, whether it’s a stock market, forex, commodities, or cryptocurrencies.
2. How the Zig-Zag Donchian Works
The Zig-Zag Donchian works by combining the calculation of Zig-Zag pivots with Donchian channels, which are constructed using the highest and lowest price values over a specified period. This combination allows the indicator to identify turning points in the price direction, providing a clearer view of the current trend and potential reversal points.
The indicator uses a set of customizable parameters that allow it to be tailored to different assets and market conditions:
- Length: This parameter determines the number of bars used to calculate the upper and lower levels of the Donchian channels. A higher value will smooth the bands and generate fewer signals, while a lower value will make the indicator more sensitive to price changes.
- Bounce Speed (bsp): The bounce speed is a factor that affects how quickly the Zig-Zag adjusts to changes in price. A higher value makes the Zig-Zag more responsive to directional changes in price.
- Transparency (transp): This parameter allows you to adjust the transparency of the Donchian channel fill on the chart, improving the visualization of the channel in combination with other chart elements.
- Gradient (gradient): This parameter activates the gradient color function for the Donchian channel, providing a visual representation that shows the position of the price within the range.
- Show Signals (showsignals): This parameter enables or disables the visualization of buy and sell signals based on the Zig-Zag pivots.
In its functionality, the indicator identifies price crossings with the Donchian channels and, based on these crossings, generates signals indicating potential trend changes. The Zig-Zag pivots adjust according to changes in price direction, allowing the trader to observe how the price interacts with the upper and lower levels of the Donchian channel.
This process provides an effective visual tool for identifying dynamic support and resistance zones, as well as anticipating potential reversals in market trends.
3. Calculation of Donchian Channels
The Zig-Zag Donchian uses Donchian channels to identify the highest and lowest price levels within a defined period. These channels are constructed by taking the highest and lowest values of the price (by default, the closing price) over a specified number of bars. This helps establish the upper and lower boundaries within which the price will move.
In the code, the Donchian channels are calculated using the following commands:
|
1 2 |
upper = highest[length](src) lower = lowest[length](src) |
- upper: Defines the upper limit of the Donchian channel and is calculated by identifying the highest price reached during the period specified by the
lengthparameter. - lower: Defines the lower limit of the Donchian channel and is obtained by finding the lowest price during the same period.
The length parameter determines the number of bars that will be used for this calculation. By default, a value of 20 is used, meaning that the indicator will consider the most recent 20 periods to determine the upper and lower levels.
These bands serve as dynamic references to identify the price range’s amplitude over a specific period. Using Donchian channels in combination with the Zig-Zag provides traders with information about zones where the price might find resistance (upper level) or support (lower level), helping to anticipate potential trend reversal points.
4. Calculation of the Zig-Zag
The Zig-Zag component of the indicator is responsible for identifying turning points in the price direction within the Donchian channels. The goal is to eliminate market noise and highlight only the most relevant movements, facilitating the identification of local highs and lows.
The calculation of the Zig-Zag is based on the following steps:
- Detection of crossings with Donchian channels: The Zig-Zag checks whether the price has crossed the upper or lower Donchian channels. The conditions are:
12crossupper = zz[1] crosses over upper or zz[1] crosses under uppercrosslower = zz[1] crosses over lower or zz[1] crosses under lower
Here,
zzrepresents the current value of the Zig-Zag, andzz[1]is its value in the previous bar. If a crossing with the upper or lower band is detected, a signal indicating a change in direction is generated. - Determination of the oscillator (
osc): Theoscoscillator indicates the direction of the price movement and is defined as:1234567if crossupper thenosc = -1elsif crosslower thenosc = 1elseosc = oscendif- When a crossing with the upper band (
crossupper) occurs, the oscillator takes a value of -1, indicating a potential shift to a bearish trend. - When a crossing with the lower band (
crosslower) occurs, the oscillator is set to 1, signaling a possible shift to a bullish trend.
- When a crossing with the upper band (
- Zig-Zag update: If a change in the oscillator direction is detected, the difference between the upper and lower bands (
val) is calculated to adjust the Zig-Zag value:123if osc <> osc[1] thenval = upper - lowerendifFinally, the Zig-Zag value is updated using the formula:
123if barindex > 2 * length thenzz = zz[1] + osc * val * bsp / lengthendif
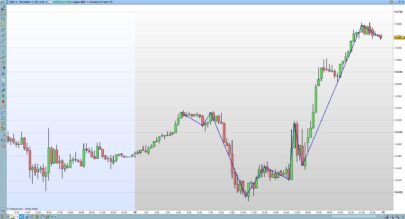
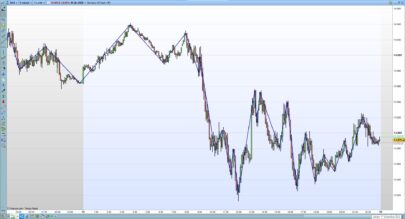
The final result is a Zig-Zag indicator that follows price movements within the limits set by the Donchian channels, providing a clear visual approach to identifying directional changes and market trends.
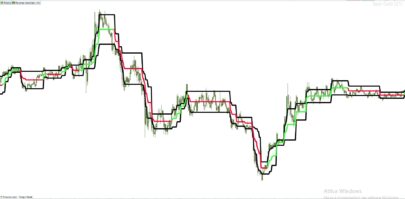
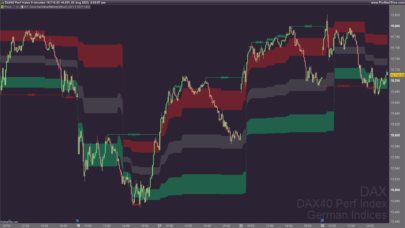
5. Visualization of the Donchian Channel
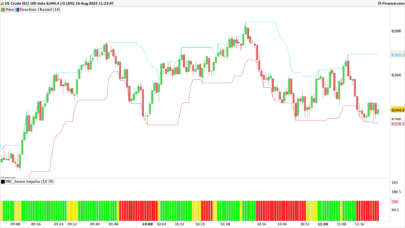
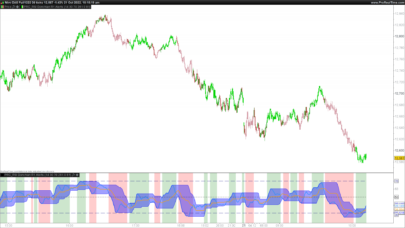
The Zig-Zag Donchian indicator not only uses Donchian channels to detect price reversal points but also displays them visually on the chart, providing a clear representation of the price range. To enhance the interpretation of price movements, the Donchian channel is filled with a color gradient indicating the price’s position within the range.
Gradient Color Calculation
The indicator calculates the current position of the price within the Donchian channels using the following formula:
|
1 2 |
source = max(min((src - lower) / (upper - lower), 1), 0) norm = average[length](source) |
source: Represents the normalization of the price position (src) within the channels. It takes a value between 0 and 1, where 0 indicates the price is at the lower band and 1 indicates it’s at the upper band.norm: Calculates an average ofsourceover thelengthperiod to smooth variations.
This normalized value is used to determine the color of the Donchian channel, applying different shades based on the price’s position within the range.
When norm is low, the channel is shown in red tones, indicating that the price is close to the lower level. As norm increases, the color gradually changes from orange to yellow, green, and finally to bright green when the price nears the upper level.
This gradient helps visualize price movement within the channel, providing additional information about the current trend’s strength.
Filling the Donchian Channel
The indicator uses the colorbetween() function to fill the channel between the upper and lower levels with the calculated colors, applying the transparency defined by the transp parameter:
|
1 |
colorbetween(upper, lower, r, g, b, transp) |
6. Buy and Sell Signals
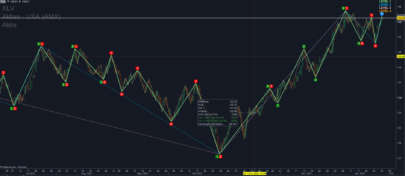
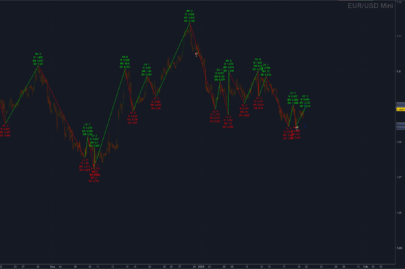
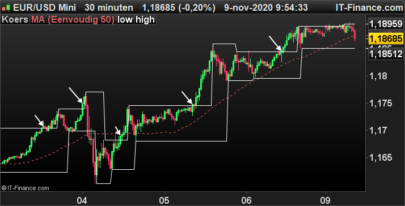
The Zig-Zag Donchian generates buy and sell signals based on the pivots detected by the Zig-Zag component. These signals help traders identify entry and exit points in the market, making it a comprehensive tool for technical analysis.
- Sell Signal (Red Arrow): Generated when a local high is detected, i.e., when the current value (
zz) is lower than the previous value (zz[1]) and the value two periods ago (zz[2]). This indicates a possible downward reversal, and a red arrow is drawn on the chart. - Buy Signal (Green Arrow): Produced when a local low is detected, meaning the current value (
zz) is higher than the previous (zz[1]) and the one two periods ago (zz[2]). This indicates a potential upward reversal, and a green arrow is displayed on the chart.
7. Customizable Parameters
The Zig-Zag Donchian is a flexible indicator that allows you to adjust several parameters to adapt it to different financial assets and market conditions.
- length: The number of bars used to calculate the Donchian channels.
- bsp: Bounce speed multiplier affecting how quickly the Zig-Zag responds.
- transp: Transparency level for the Donchian channel fill.
- gradient: Controls the gradient colors for the channel.
- showsignals: Enables or disables buy and sell signals.
8. Zig-Zag Donchian Indicator Code
|
1 2 3 4 5 6 7 8 9 10 11 12 13 14 15 16 17 18 19 20 21 22 23 24 25 26 27 28 29 30 31 32 33 34 35 36 37 38 39 40 41 42 43 44 45 46 47 48 49 50 51 52 53 54 55 56 57 58 59 60 61 62 63 64 65 66 67 68 69 70 71 72 73 74 75 76 77 78 79 80 81 82 83 84 85 86 87 88 89 90 |
//-----------------------------------------------------------------// //PRC_Donchian Zigzag //version = 0 //13.08.2024 //Iván González @ www.prorealcode.com //Sharing ProRealTime knowledge //-----------------------------------------------------------------// //-----Inputs------------------------------------------------------// //-----------------------------------------------------------------// src=close length=20 bsp=1 //Bounce speed transp=120 gradient=1 showsignals=1 //-----------------------------------------------------------------// //-----Donchian Upper and Lower------------------------------------// //-----------------------------------------------------------------// upper=highest[length](src) lower=lowest[length](src) //-----------------------------------------------------------------// //-----Zig-Zag-----------------------------------------------------// //-----------------------------------------------------------------// once zz=src crossupper=zz[1] crosses over upper or zz[1] crosses under upper crosslower=zz[1] crosses over lower or zz[1] crosses under lower if crossupper then osc=-1 elsif crosslower then osc=1 else osc=osc endif if osc<>osc[1] then val=upper-lower endif if barindex > 2*length then zz = zz[1]+osc*val*bsp/length endif //-----------------------------------------------------------------// //-----Fill Donchian channel---------------------------------------// //-----------------------------------------------------------------// source=max(min((src-lower)/(upper-lower),1),0) norm=average[length](source) if gradient then if norm < 0.2 then r=255 g=0 b=0 elsif norm>=0.20 and norm<0.40 then r=255 g=168 b=0 elsif norm>=0.40 and norm<0.60 then r=214 g=188 b=26 elsif norm>=0.60 and norm<0.80 then r=172 g=204 b=52 elsif norm>=0.80 then r=48 g=255 b=83 endif else r=120 g=120 b=120 endif colorbetween(upper,lower,r,g,b,transp) //-----------------------------------------------------------------// //-----Signals-----------------------------------------------------// //-----------------------------------------------------------------// if showsignals then if zz<zz[1] and zz[1]>zz[2] then drawarrowdown(barindex[1],zz[1]+tr) coloured("red") elsif zz>zz[1] and zz[1]<zz[2] then drawarrowup(barindex[1],zz[1]-tr) coloured("green") endif endif //-----------------------------------------------------------------// return upper as "Lmax" , lower as "Lmin", zz as "ZigZag" coloured("blue")style(line,2) |
9. Conclusion
The Zig-Zag Donchian is a versatile and powerful tool that combines Zig-Zag pivots with Donchian channels to offer a clear visual representation of trends and turning points. With its customizable parameters, this indicator can be tailored to suit various trading strategies, making it an invaluable resource for traders aiming to enhance their accuracy in identifying trading opportunities.
Share this
No information on this site is investment advice or a solicitation to buy or sell any financial instrument. Past performance is not indicative of future results. Trading may expose you to risk of loss greater than your deposits and is only suitable for experienced investors who have sufficient financial means to bear such risk.
ProRealTime ITF files and other attachments :
Find other exclusive trading pro-tools on ![]()
PRC is also on YouTube, subscribe to our channel for exclusive content and tutorials

Hello Ivan, another great Indicator, very useful to trace the trend ( blue line) and the possible Breakout ( price over/under the blue line)!! Thank you!
🙂