

ZigZag Fibonacci levels
October 17, 2018, 9:42 AM
Indicators
11 Comments
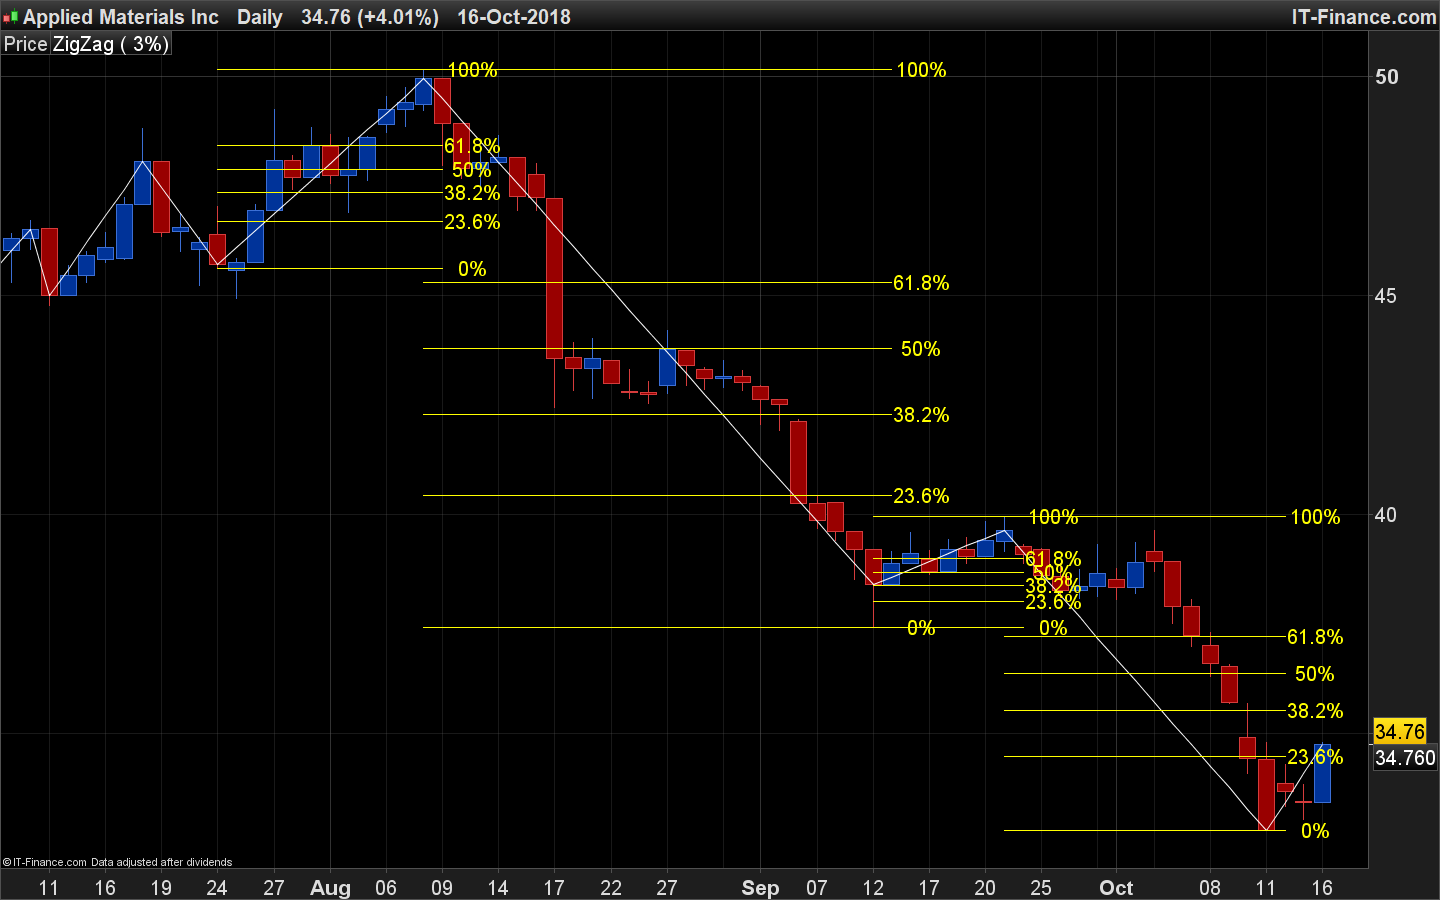
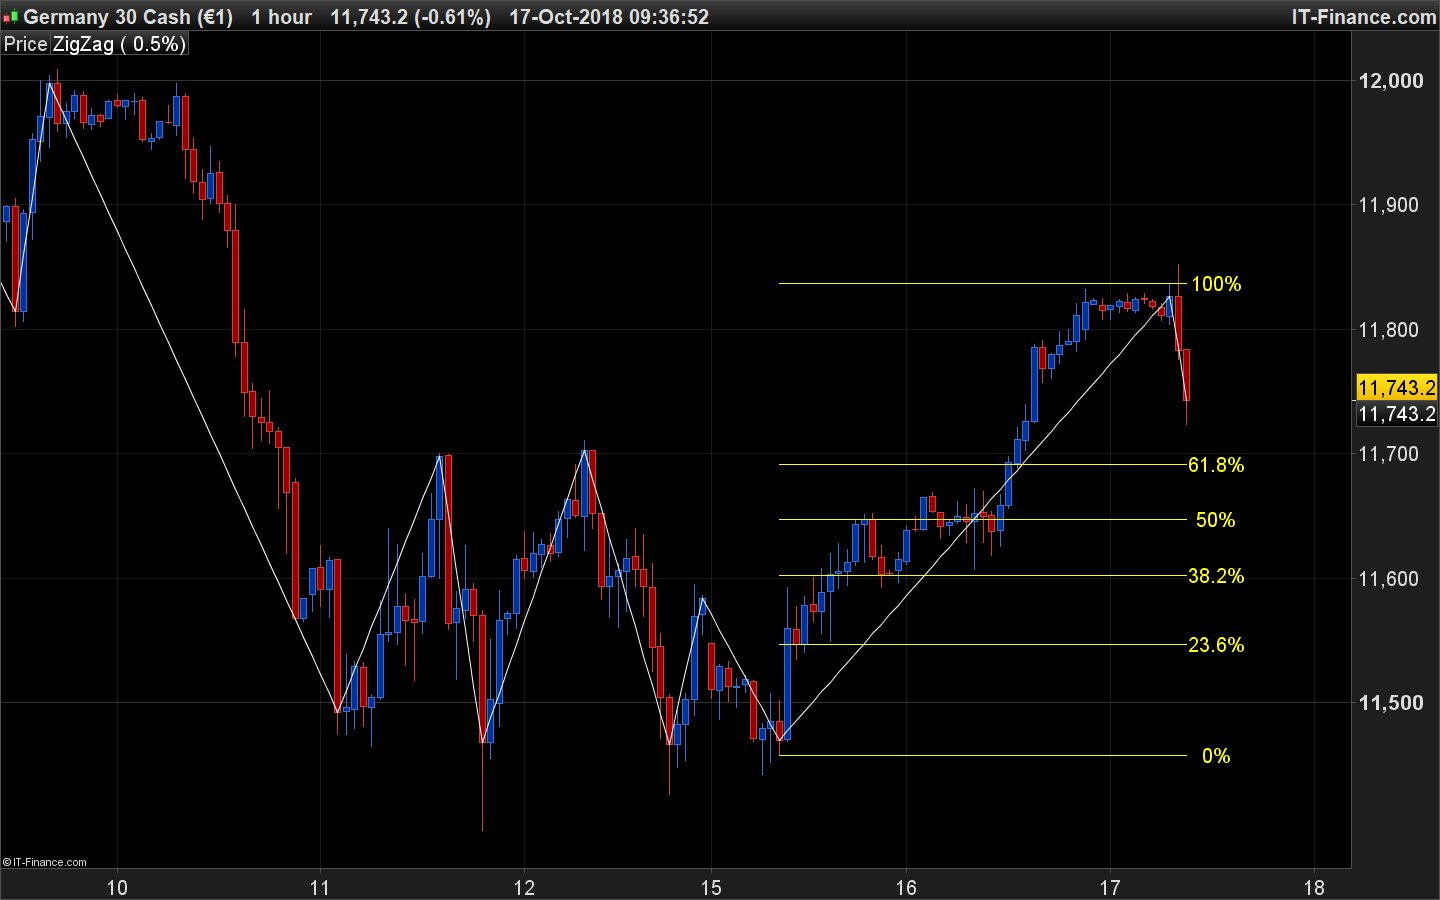
This indicator plot Fibonacci levels based on the ZigZag indicator of the platform.
The zigzag tops and bottoms are calculated within the “percent” setting and on candlesticks Close (not highs/lows).
Levels colours can be modified with the R,G,B setting, by default levels are plotted in yellow.
The “DaysBefore” setting is important, because it prevents or not previous Fibonacci levels to be plot or not on the price chart. Expand its value to a large number will ensure the levels will be detected and plotted for the higher timeframes. In fact, it all depends of the zigzag percentage and the timeframe you are using.
//PRC_ZigZag Fibonacci levels | indicator
//17.10.2018
//Nicolas @ www.prorealcode.com
//Sharing ProRealTime knowledge

// --- settings
percent = 0.5
//color:
r=255
g=255
b=0
DaysBefore = 20
// --- end of settings

zz = zigzag[percent](close)

top = zz<zz[1] and zz[1]>zz[2]
bot = zz>zz[1] and zz[1]<zz[2]

if top then
 highlvl = high[1]
 startbartop = barindex[1]
 idate = date[1]
endif
if bot then
 lowlvl = low[1]
 startbarbot = barindex[1]
 idate = date[1]
endif

newtop = top<>top[1]
newbot = bot<>bot[1]

if newtop or newbot then
 fullrange = abs(highlvl-lowlvl)

 fibo236 = lowlvl+(fullrange*0.236)
 fibo382 = lowlvl+(fullrange*0.382)
 fibo50 = lowlvl+fullrange/2
 fibo618 = lowlvl+(fullrange*0.618)
 startbar = min(startbartop,startbarbot)

 //plot fibonacci levels
 if startbar<>lastplot and today-idate<DaysBefore then
  drawsegment(startbar,highlvl,barindex,highlvl) coloured(r,g,b)
  drawtext("          100%",barindex,highlvl,Dialog,Standard,20) coloured(r,g,b)
  drawsegment(startbar,lowlvl,barindex,lowlvl) coloured(r,g,b)
  drawtext("          0%",barindex,lowlvl,Dialog,Standard,20) coloured(r,g,b)
  drawsegment(startbar,fibo236,barindex,fibo236) coloured(r,g,b)
  drawtext("          23.6%",barindex,fibo236,Dialog,Standard,20) coloured(r,g,b)
  drawsegment(startbar,fibo382,barindex,fibo382) coloured(r,g,b)
  drawtext("          38.2%",barindex,fibo382,Dialog,Standard,20) coloured(r,g,b)
  drawsegment(startbar,fibo50,barindex,fibo50) coloured(r,g,b)
  drawtext("          50%",barindex,fibo50,Dialog,Standard,20) coloured(r,g,b)
  drawsegment(startbar,fibo618,barindex,fibo618) coloured(r,g,b)
  drawtext("          61.8%",barindex,fibo618,Dialog,Standard,20) coloured(r,g,b)
  lastplot = startbar
 endif
endif

return
Download
Filename:
PRC_ZigZag-Fibonacci-levels.itf
Downloads:
1255
Download
Filename:
zigzag-fibonacci-levels-indicator.png
Downloads:
388
Legend
I created ProRealCode because I believe in the power of shared knowledge. I spend my time coding new tools and helping members solve complex problems.
If you are stuck on a code or need a fresh perspective on a strategy, I am always willing to help. Welcome to the community!
Author’s Profile
Loading...