
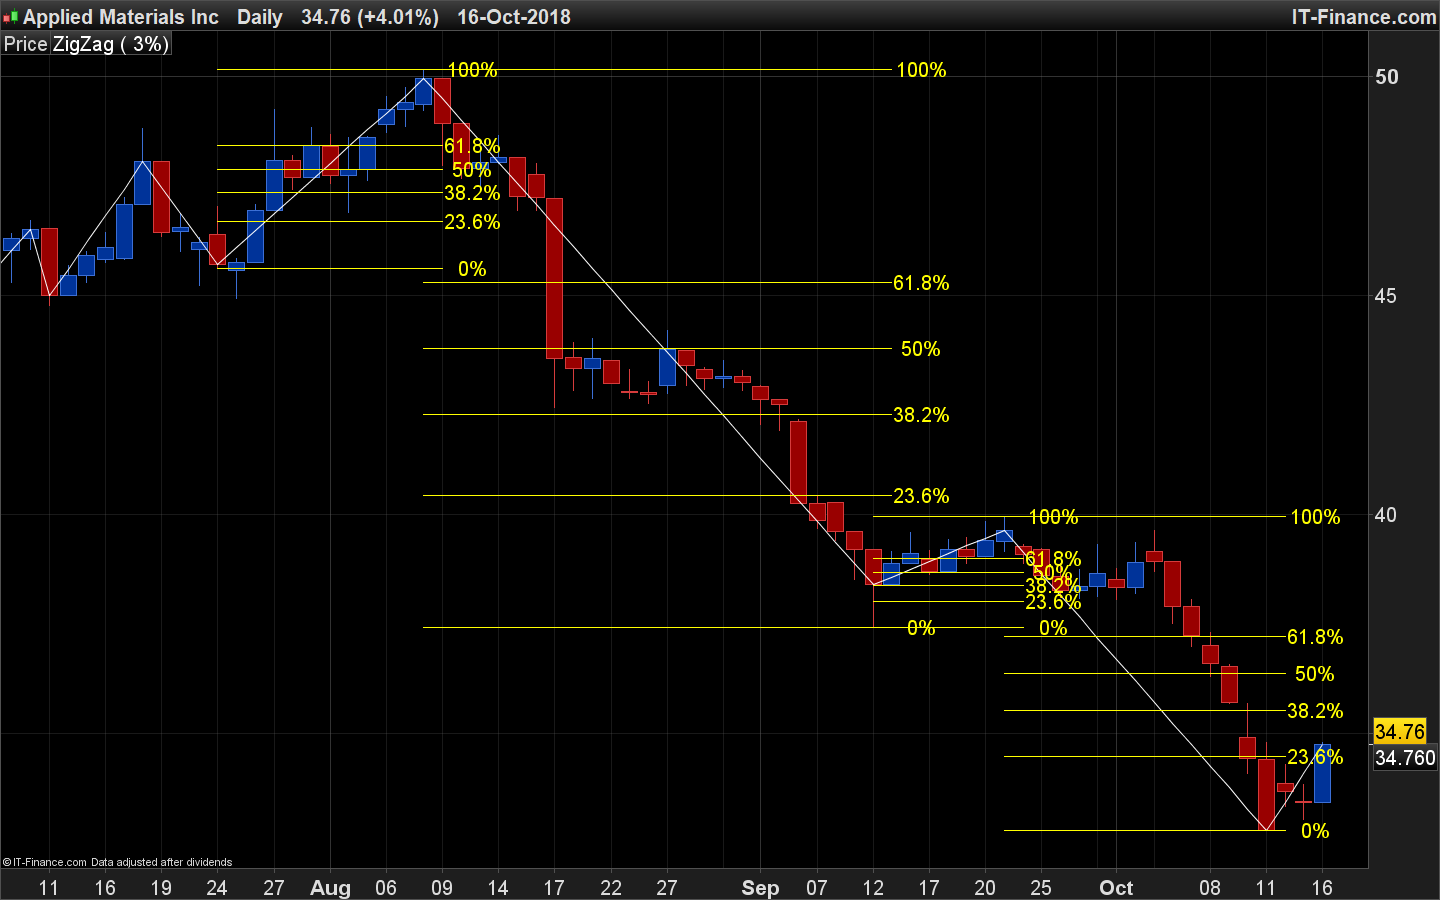
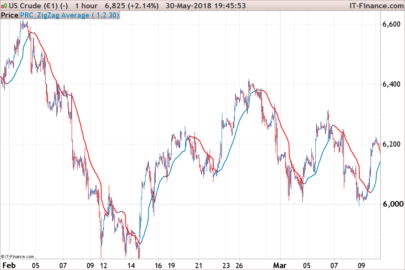
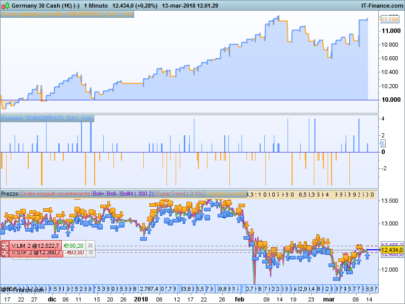
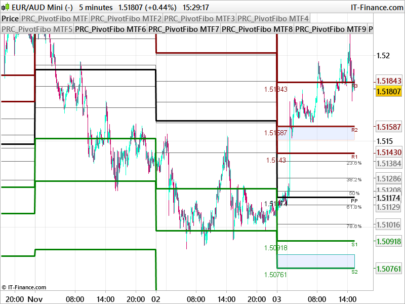
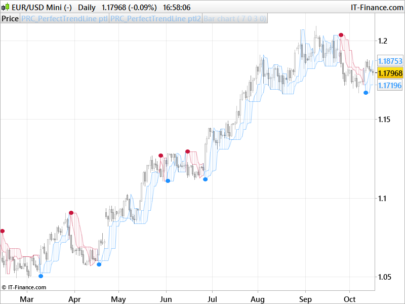
This indicator plot Fibonacci levels based on the ZigZag indicator of the platform.
The zigzag tops and bottoms are calculated within the “percent” setting and on candlesticks Close (not highs/lows).
Levels colours can be modified with the R,G,B setting, by default levels are plotted in yellow.
The “DaysBefore” setting is important, because it prevents or not previous Fibonacci levels to be plot or not on the price chart. Expand its value to a large number will ensure the levels will be detected and plotted for the higher timeframes. In fact, it all depends of the zigzag percentage and the timeframe you are using.
|
1 2 3 4 5 6 7 8 9 10 11 12 13 14 15 16 17 18 19 20 21 22 23 24 25 26 27 28 29 30 31 32 33 34 35 36 37 38 39 40 41 42 43 44 45 46 47 48 49 50 51 52 53 54 55 56 57 58 59 60 61 |
//PRC_ZigZag Fibonacci levels | indicator //17.10.2018 //Nicolas @ www.prorealcode.com //Sharing ProRealTime knowledge // --- settings percent = 0.5 //color: r=255 g=255 b=0 DaysBefore = 20 // --- end of settings zz = zigzag[percent](close) top = zz<zz[1] and zz[1]>zz[2] bot = zz>zz[1] and zz[1]<zz[2] if top then highlvl = high[1] startbartop = barindex[1] idate = date[1] endif if bot then lowlvl = low[1] startbarbot = barindex[1] idate = date[1] endif newtop = top<>top[1] newbot = bot<>bot[1] if newtop or newbot then fullrange = abs(highlvl-lowlvl) fibo236 = lowlvl+(fullrange*0.236) fibo382 = lowlvl+(fullrange*0.382) fibo50 = lowlvl+fullrange/2 fibo618 = lowlvl+(fullrange*0.618) startbar = min(startbartop,startbarbot) //plot fibonacci levels if startbar<>lastplot and today-idate<DaysBefore then drawsegment(startbar,highlvl,barindex,highlvl) coloured(r,g,b) drawtext(" 100%",barindex,highlvl,Dialog,Standard,20) coloured(r,g,b) drawsegment(startbar,lowlvl,barindex,lowlvl) coloured(r,g,b) drawtext(" 0%",barindex,lowlvl,Dialog,Standard,20) coloured(r,g,b) drawsegment(startbar,fibo236,barindex,fibo236) coloured(r,g,b) drawtext(" 23.6%",barindex,fibo236,Dialog,Standard,20) coloured(r,g,b) drawsegment(startbar,fibo382,barindex,fibo382) coloured(r,g,b) drawtext(" 38.2%",barindex,fibo382,Dialog,Standard,20) coloured(r,g,b) drawsegment(startbar,fibo50,barindex,fibo50) coloured(r,g,b) drawtext(" 50%",barindex,fibo50,Dialog,Standard,20) coloured(r,g,b) drawsegment(startbar,fibo618,barindex,fibo618) coloured(r,g,b) drawtext(" 61.8%",barindex,fibo618,Dialog,Standard,20) coloured(r,g,b) lastplot = startbar endif endif return |
Share this
No information on this site is investment advice or a solicitation to buy or sell any financial instrument. Past performance is not indicative of future results. Trading may expose you to risk of loss greater than your deposits and is only suitable for experienced investors who have sufficient financial means to bear such risk.
ProRealTime ITF files and other attachments :
Find other exclusive trading pro-tools on ![]()
PRC is also on YouTube, subscribe to our channel for exclusive content and tutorials


WOW! i was looking for something like this! Thank you!
Bonjour Nicolas
Je débute et j’ai installé votre indicateur sur l’écran du prix mais je ne comprends pas comment il fonctionne car je n’ai aucun trait qui se dessine. J’ai installé aussi l’indicateur zigzag. Pourriez vous m’indiquer comment le mettre en place?
Merci
Le seul paramètre c’est le pourcentage du zigzag, à modifier selon convenance et le timeframe employé. Assurez vous d’avoir suffisamment d’unités affichées sur l’écran.
How can I see the ZigZag? Only Fibo is drawn. THX ./alex
Add the ZigZag indicator on the chart, and with the same percent setting as this indicator.
Hello Nicolas,
Il semble que la variable DaysBefore fasse planter la représentation graphique = quand je la supprime ça fonctionne parfaitement ;
pour ma gouverne, quelle est l’idée derrière ?
Bien à toi,
Peut-être à cause du manque d’historique. Celle-ci est utile pour limiter la quantité de retracement à afficher/trouver. C’est écrit dans la description pourtant 🙂
Would it be possible to use 2 or 3 points to do the calculations done in this case using zigzag indicator. For example, use an object and plot 3 points then use these coordinates to get fib levels rather than using automatic zigzag? So, instead of top and bottom of zigzag, we would use two points indicated by an object eg, a simple line or in new version elliot ABC plots? Are these kinds of indicator generation supported?
Sure, I suggest you open a new topic in the forum to discuss about your ideas.
Bonjour Nicolas, est ce que l’on peut en faire une stratégie de trading automatisée ?
Non, pas en utilisant l’indicateur zigzag traditionnel de la plateforme.