







ZigZag Indicator
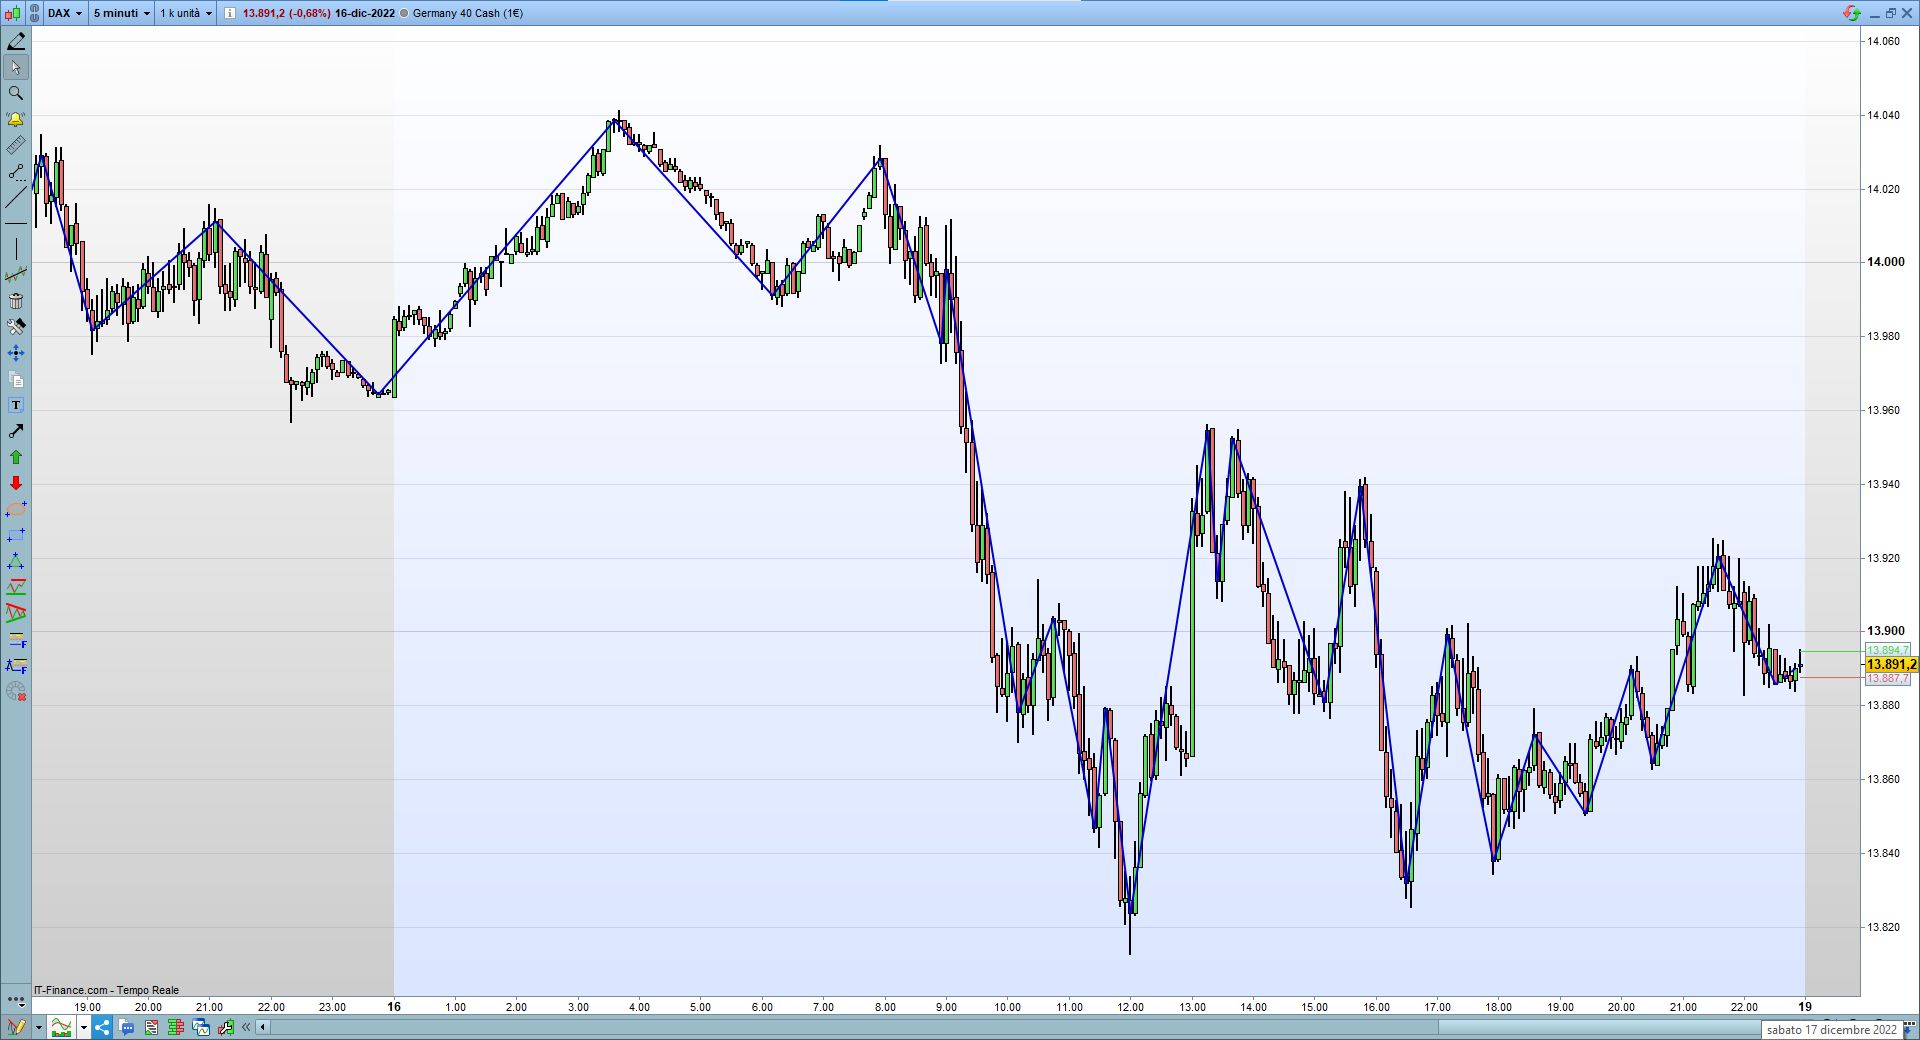
Code for the zigzag indicator with the use of array.
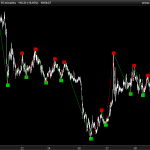
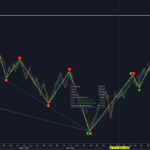
I compared it with the platform indicator, and the results are almost identical in both pips and percentage modes.
With the “Type” variable it is possible to switch the functioning between “Points” and “Percentage” (Note: in the case of ZZ in %, I used the Day Close of the previous day as a basis for calculation to give stability to the reference; using the ” close” with very low % values, sometimes the recalculation gives rise to graphical artifacts)
The “Segments” variable decides how many pairs of up/down segments to display on the graph.
//17/12/2022 - T.F. - ZigZag code with Array
//Sharing ProRealCode

DEFPARAM DRAWONLASTBARONLY=TRUE
//Variables:
//Points=20    //Pips
//Perc=0.25    //%
//Type=0       //0=pips; 1=perc
//Segments=10  //n. segments up/dw to show


PI=max(0,(Segments-1)) //points top/low back to store
VarY=CustomClose //close,tpicalprice, etc

//inizializzo primo punto come TOP
once LastPoint = 1
once $TX[0]    = barindex
once $TY[0]    = VarY

//Tipo ZZ in Punti o Percentuale
If Type=0 then //ZZ in pips
DeltaY=max(2*pipsize,Points*pipsize)
elsif Type=1 then //ZZ in %
DeltaY=max(0.001,Perc/100*Dclose(1)*pipsize) //Dclose used as ref.
endif

//ZZ in fase 1
if LastPoint=1 then //lastpoint was a top
if VarY>$TY[0] then //update last top and stay in LastPoint=1
$TY[0]=VarY
$TX[0]=barindex
elsif VarY<=($TY[0]-DeltaY) then //first point in low
for i=PI downto 0 do //shift memory previous points
$LX[i+1]=$LX[i]
$LY[i+1]=$LY[i]
next
$LY[0]=VarY //store new low and change lastpoint
$LX[0]=barindex
LastPoint=-1
endif
endif

//ZZ in fase -1
if LastPoint=-1 then //lastpoint was a low
if VarY<$LY[0] then //update last low and stay in LastPoint=-1
$LY[0]=VarY
$LX[0]=barindex
elsif VarY>=($LY[0]+DeltaY) then //first point in top
for i=PI downto 0 do  //shift memory previous points
$TX[i+1]=$TX[i]
$TY[i+1]=$TY[i]
next
$TY[0]=VarY //store new top and change lastpoint
$TX[0]=barindex
LastPoint=1
endif
endif

//---GRAPH---
If LastPoint=1 then
drawsegment (barindex,VarY,$TX[0],$TY[0]) style (dottedline,2) COLOURED (0,0,200) //segment in progress
for i=0 to PI do //final segments
drawsegment ($TX[i],$TY[i],$LX[i],$LY[i]) style (line,2) COLOURED (0,0,200)
drawsegment ($LX[i],$LY[i],$TX[i+1],$TY[i+1]) style (line,2) COLOURED (0,0,200)
next
endif
If LastPoint=-1 then
drawsegment (barindex,VarY,$LX[0],$LY[0]) style (dottedline,2) COLOURED (0,0,200) //segment in progress
for i=0 to PI do //final segments
drawsegment ($LX[i],$LY[i],$TX[i],$TY[i]) style (line,2) COLOURED (0,0,200)
drawsegment ($TX[i],$TY[i],$LX[i+1],$LY[i+1]) style (line,2) COLOURED (0,0,200)
next
endif

return
Comments
You must be logged in to post a comment.

Thanks for this! My version uses highs and lows and uses 3 * ATR as the minimum difference between points: DEFPARAM DRAWONLASTBARONLY=TRUE //Variabili: Punti=3 * averagetruerange[200] //Pips Percentuale=0.25 //% Tipo=0 //0=pips; 1=perc //VarY=CustomClose //close,tpicalprice, etc //inizializzo primo punto come TOP once LastPoint = 1 once TX0 = barindex once TY0 = close //Tipo ZZ in Punti o Percentuale If Tipo=0 then //ZZ in punti DeltaY=Punti//*pipsize elsif tipo=1 then //ZZ in % DeltaY=Percentuale/100*Dclose(1)//usato Dclose come rif. per stabilità del valore endif //ZZ in fase 1 if LastPoint=1 then //ultimo punto era un massimo if high>=TY0 then // aggiorno il punto di max e rimango in LastPoint=1 TY0=high TX0=barindex elsif low<=TY0-DeltaY then //primo punto definitivo low rem for i=PI downto 0 do //shift memoria punti precedenti LX4=LX3 LY4=LY3 LX3=LX2 LY3=LY2 LX2=LX1 LY2=LY1 LX1=LX0 LY1=LY0 LY0=low LX0=barindex LastPoint=-1 endif endif //ZZ in fase -1 if LastPoint=-1 then //ultimo punto era un minimo if low<=LY0 then // aggiorno il punto di min e rimango in LastPoint=-1 LY0=low LX0=barindex elsif high>=LY0+DeltaY then //primo punto definitivo top TX4=TX3 TY4=TY3 TX3=TX2 TY3=TY2 TX2=TX1 TY2=TY1 TX1=TX0 TY1=TY0 TY0=high TX0=barindex LastPoint=1 endif endif //—GRAFICA— If lastpoint=1 then drawsegment (barindex,high,TX0,TY0) style (dottedline,2) COLOURED (0,0,200) //segmento in progress drawsegment (TX0,TY0,LX0,LY0) style (line,2) COLOURED (0,0,200) //segmenti definitivi drawsegment (LX0,LY0,TX1,TY1) style (line,2) COLOURED (0,0,200) drawsegment (TX1,TY1,LX1,LY1) style (line,2) COLOURED (0,0,200) drawsegment (LX1,LY1,TX2,TY2) style (line,2) COLOURED (0,0,200) drawsegment (TX2,TY2,LX2,LY2) style (line,2) COLOURED (0,0,200) drawsegment (LX2,LY2,TX3,TY3) style (line,2) COLOURED (0,0,200) drawsegment (TX3,TY3,LX3,LY3) style (line,2) COLOURED (0,0,200) drawsegment (LX3,LY3,TX4,TY4) style (line,2) COLOURED (0,0,200) drawsegment (TX4,TY4,LX4,LY4) style (line,2) COLOURED (0,0,200) endif If lastpoint=-1 then drawsegment (barindex,low,LX0,LY0) style (dottedline,2) COLOURED (0,200,0) //segmento in progress drawsegment (LX0,LY0,TX0,TY0) style (line,2) COLOURED (0,0,200) //segmenti definitivi drawsegment (TX0,TY0,LX1,LY1) style (line,2) COLOURED (0,0,200) drawsegment (LX1,LY1,TX1,TY1) style (line,2) COLOURED (0,0,200) drawsegment (TX1,TY1,LX2,LY2) style (line,2) COLOURED (0,0,200) drawsegment (LX2,LY2,TX2,TY2) style (line,2) COLOURED (0,0,200) drawsegment (TX2,TY2,LX3,LY3) style (line,2) COLOURED (0,0,200) drawsegment (LX3,LY3,TX3,TY3) style (line,2) COLOURED (0,0,200) drawsegment (TX3,TY3,LX4,LY4) style (line,2) COLOURED (0,0,200) drawsegment (LX4,LY4,TX4,TY4) style (line,2) COLOURED (0,0,200) endif return
A good alternative solution, even I had thought of the variant that uses high and low (probabily better than "Close") Another solution that I'm testing (and that seems to work very well when used on timeframe < day) is to use a % of the daily ATR as a parameter for the change of direction: 30% of the daily ATR value ( on 5 days, excluding today) seems to me the best one to follow the market swings on 15M. I use this setup for 1-2-3 strategy Add at the The code: time frame (1 day) Atrd=AverageTrueRange[5](close)[1] //Average Daily max variations, today excluded to avoid recalculations on the ATRD value time frame (default) VarY=CustomClose //close,tpicalprice, etc //initialize first point as TOP once LastPoint = 1 ounces TX0 = barindex ounces TY0 = VarY //Type ZZ in Points or Percentage If Type=0 then //ZZ in points DeltaY=Points*pipsize elsif type=1 then //ZZ in % DeltaY=Percentage/100*Dclose(1) //used Dclose as ref. for value stability //newtype=2 elsif type=2 then //ZZ in % on ATR Daily DeltaY=PercOnATRD/100*Atrd //value in points calculated as % on atrd endif
The coordinates of the zigzag points are stored in the arrays $TX,$TY (for tops) and $LX,$LY (for lows). The last point is stored in index 0, the previous point in index 1 and so on... But the version I posted above had some problems which were fixed by Roberto (many thanks!), see link to discussion for the modification needed: https://www.prorealcode.com/topic/zigzag-test-code-indicator/ For use in something like a "1-2-3 J.Ross" strategy, I suggest you to use version 1 that I posted later in the discussion, which draws the zigazag the traditional way, without using arrays , only for the last segments: the coordinates of the last point are in the variables TX0, TY0 (top) LX0/LY0 (low), and the previous ones in TX1/TY1, LX1/LY1, TX2/TY2, LX2/LY2, etc. With this version, a simple 1-2-3 strategy can be, for example, entering short when: lastpoint=-1 (=price in descending phase), TY1>TY0 (=point 3<point 1 by Ross) and Close crosses under LY1 (=breakout point 2 by Ross) - [mirroring for long entering] I'm also working on it ;) //20/12/2022 - T.F. - V1: Codice ZigZag Versione v1: eliminati gli array e gestito con variabili fisse //Sharing on ProRealCode DEFPARAM DRAWONLASTBARONLY=TRUE //Variabili: //Punti=20 //Pips //Percentuale=0.25 //% //Tipo=0 //0=pips; 1=perc VarY=CustomClose //close,tpicalprice, etc //inizializzo primo punto come TOP once LastPoint = 1 once TX0 = barindex once TY0 = VarY //Tipo ZZ in Punti o Percentuale If Tipo=0 then //ZZ in punti DeltaY=Punti*pipsize elsif tipo=1 then //ZZ in % DeltaY=Percentuale/100*Dclose(1)//usato Dclose come rif. per stabilità del valore endif //ZZ in fase 1 if LastPoint=1 then //ultimo punto era un massimo if VarY>=TY0 then // aggiorno il punto di max e rimango in LastPoint=1 TY0=VarY TX0=barindex endif if VarY<=TY0-DeltaY then //primo punto definitivo low rem for i=PI downto 0 do //shift memoria punti precedenti LX4=LX3 LY4=LY3 LX3=LX2 LY3=LY2 LX2=LX1 LY2=LY1 LX1=LX0 LY1=LY0 LY0=VarY LX0=barindex LastPoint=-1 endif endif //ZZ in fase -1 if LastPoint=-1 then //ultimo punto era un minimo if VarY<=LY0 then // aggiorno il punto di min e rimango in LastPoint=-1 LY0=VarY LX0=barindex endif if VarY>=LY0+DeltaY then //primo punto definitivo top TX4=TX3 TY4=TY3 TX3=TX2 TY3=TY2 TX2=TX1 TY2=TY1 TX1=TX0 TY1=TY0 TY0=VarY TX0=barindex LastPoint=1 endif endif //---GRAFICA--- If lastpoint=1 then drawsegment (barindex,close,TX0,TY0) style (dottedline,2) COLOURED (0,0,200) //segmento in progress drawsegment (TX0,TY0,LX0,LY0) style (line,2) COLOURED (0,0,200) //segmenti definitivi drawsegment (LX0,LY0,TX1,TY1) style (line,2) COLOURED (0,0,200) drawsegment (TX1,TY1,LX1,LY1) style (line,2) COLOURED (0,0,200) drawsegment (LX1,LY1,TX2,TY2) style (line,2) COLOURED (0,0,200) drawsegment (TX2,TY2,LX2,LY2) style (line,2) COLOURED (0,0,200) drawsegment (LX2,LY2,TX3,TY3) style (line,2) COLOURED (0,0,200) drawsegment (TX3,TY3,LX3,LY3) style (line,2) COLOURED (0,0,200) drawsegment (LX3,LY3,TX4,TY4) style (line,2) COLOURED (0,0,200) drawsegment (TX4,TY4,LX4,LY4) style (line,2) COLOURED (0,0,200) endif If lastpoint=-1 then drawsegment (barindex,close,LX0,LY0) style (dottedline,2) COLOURED (0,200,0) //segmento in progress drawsegment (LX0,LY0,TX0,TY0) style (line,2) COLOURED (0,0,200) //segmenti definitivi drawsegment (TX0,TY0,LX1,LY1) style (line,2) COLOURED (0,0,200) drawsegment (LX1,LY1,TX1,TY1) style (line,2) COLOURED (0,0,200) drawsegment (TX1,TY1,LX2,LY2) style (line,2) COLOURED (0,0,200) drawsegment (LX2,LY2,TX2,TY2) style (line,2) COLOURED (0,0,200) drawsegment (TX2,TY2,LX3,LY3) style (line,2) COLOURED (0,0,200) drawsegment (LX3,LY3,TX3,TY3) style (line,2) COLOURED (0,0,200) drawsegment (TX3,TY3,LX4,LY4) style (line,2) COLOURED (0,0,200) drawsegment (LX4,LY4,TX4,TY4) style (line,2) COLOURED (0,0,200) endif return

Hi, thanks for this code. I implemented it successfully, however, I don't see an indicator. I mean: the zigzag line is drawn, but I cannot translate this line into an indicator or variable that can be used in a strategy. Suppose we call this zigzagline "zigzag" then we can test the following pattern: if zigzag[2]<zigzag[1] and zigzag[0]<zigzag[1] then there is a (local) top that delivers a short signal, and so on Regards, Jerke vd Geest The Netherlands
Not yet, I'm busy developing other strategies/indicators at the moment, but it's on my to-do list :) I think it's not that complicated to make the basic 1-2-3 strategy using this ZigZag code. As I said, with this version, a simple 1-2-3 strategy can be, for example, entering short when: lastpoint=-1 (=price in descending phase), TY1>TY0 (=point 3<point 1 by Ross) and Close crosses under LY1 (=breakout point 2 by Ross). Surely it is more difficult to make it efficient and filter it well to avoid consecutive losses in the lateral phases. Somehow we should take into account the basic trend, and block the strategy in moments of low volatility. Even the type of money management (such as setting the target and the stop) can completely change the performance.