







ZigZag Volume by Price Fibonacci Indicator (FIZIVOL)
Hi Coders,
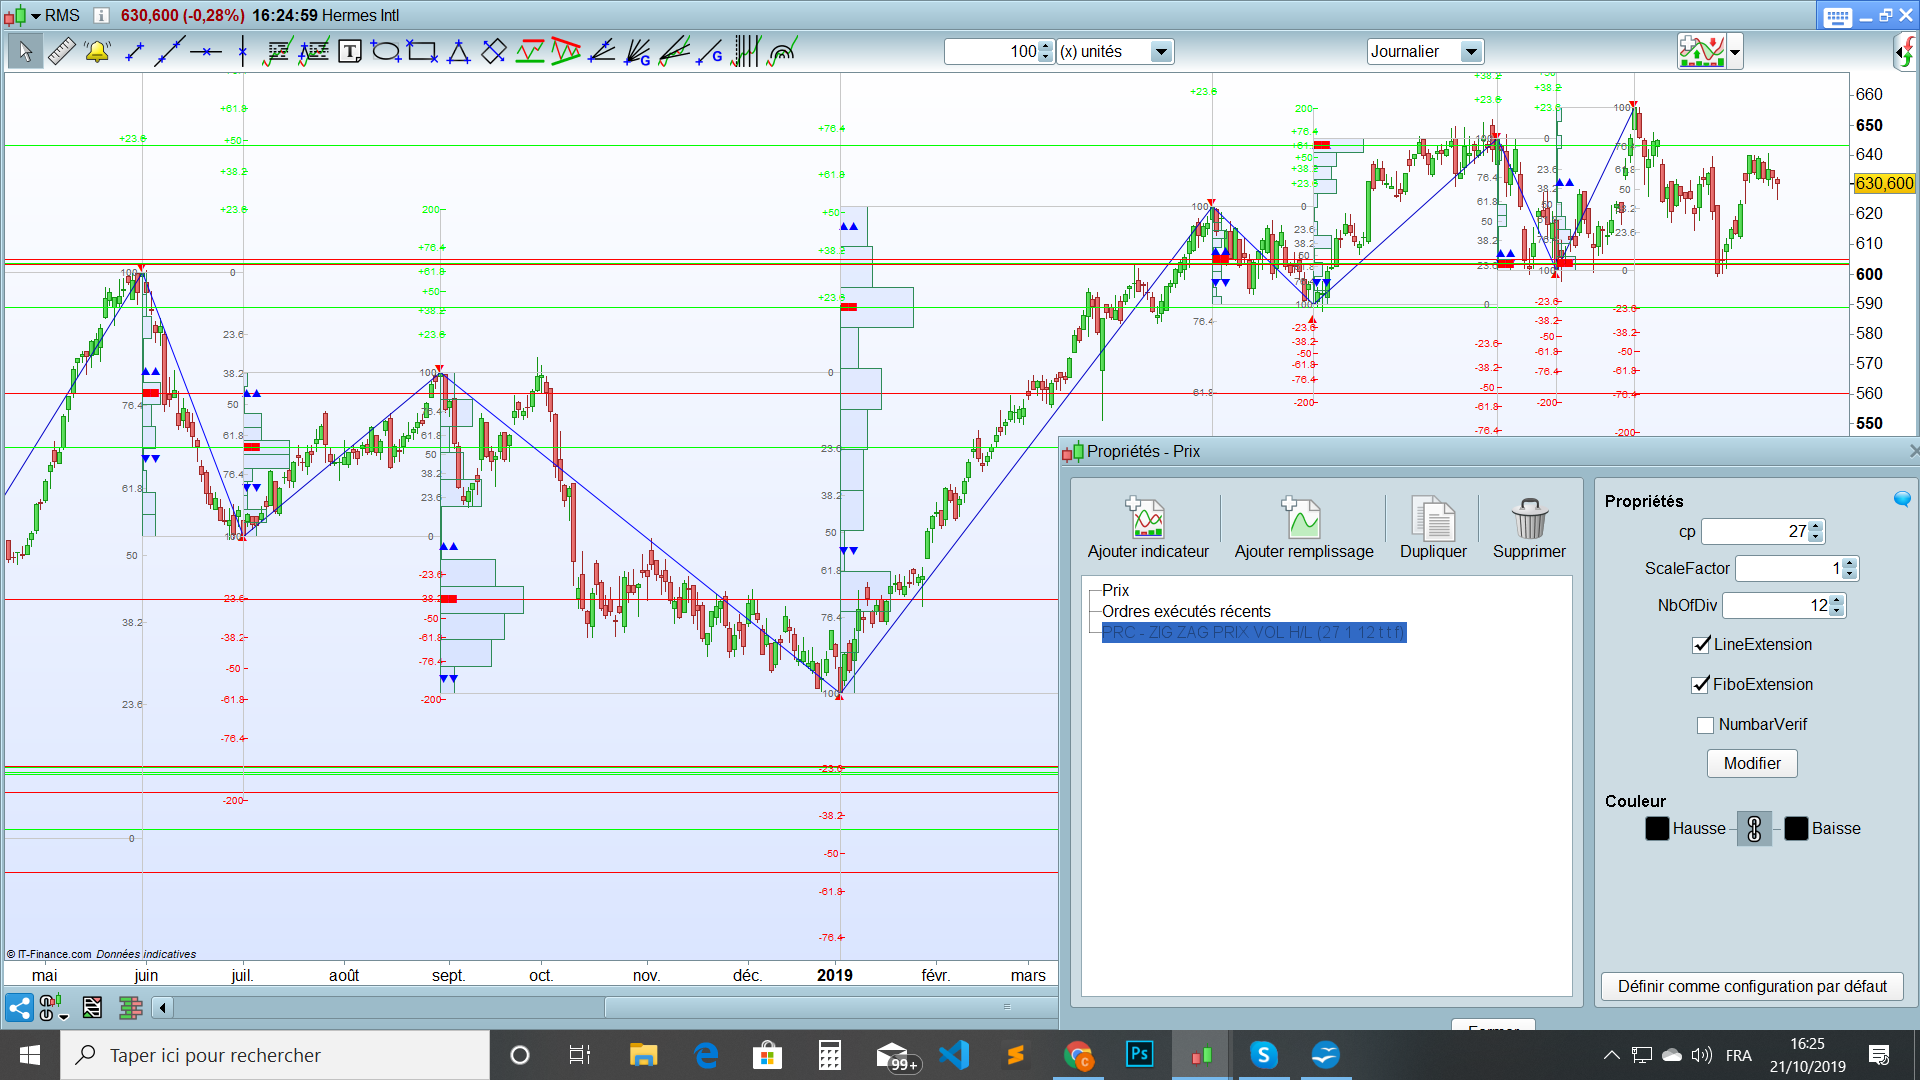
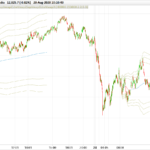
This is an improved version of a Volume Price Level indicator I proposed lately, combined with the work of Nicolas on ZigZag.
https://www.prorealcode.com/prorealtime-indicators/multi-fractals-zigzag-highlow/
https://www.prorealcode.com/prorealtime-indicators/volume-by-price-levels-v2-extended/
It allows us to
- clearly identify the future supports and resistances of the next price sequence
- identify the next possible extensions or regression of the price on Fibonacci levels
- the weekness in the price structure that could provoke gaps or accelerations
- and above all it opens the path to automatize a strategy
▀ ▀ = MaxVol level
▼▼ or ▲▲= MinVol Levels above or under the MaxVol level
I am captive to read from you what would be the best way to optimize a strategy
- entry/exit signal
- effective stoploss and trailing stop
Please feel free to give to this code some enhancements or correct it if you see errors.
Enjoy
Chris
//The main goal of this indicator is to identify strengh and weekness in the distribution of volume per price
//and to identify future support and resistance in the next ZIG ZAG sequence
//
//VolumebypricelevelsV2Extended by Kris75
//VolumeByPrice HighLowBreakdown (mods by Kris75)
//PRC_multi-fractals-zigzag-highlow | indicator
//PRC_Bull&Bear Volume on Price | indicator
//05.07.2018
//Nicolas @ www.prorealcode.com
//Sharing ProRealTime knowledge


r=100
g=100
b=100

r1=200
g1=200
b1=200


//---major zigzag points

if lastpoint <= 0 then
if close[cp] >= highest[2*cp+1](close) then
NewPeak = 1
HighCp = high[cp]
Higher = close[cp]
HigherBarIndex = barindex[cp]
else
NewPeak = 0
endif
endif


if NewPeak then


NewHigherBarIndex = HigherBarIndex
LastLowerBarIndex = NewLowerBarIndex
NewHigher = higher
LastLower = NewLower
LagAfterSignal = abs(barindex-NewHigherBarIndex)
lastpoint=1

drawsegment (lastLowerBarindex,lastlower,HigherBarIndex,NewHigher) coloured (0,0,200)
drawsegment (NewHigherBarIndex,lastlower,NewHigherBarIndex,NewHigher) coloured (r1,g1,b1)
drawtext("▼", NewHigherBarIndex,HighCp) coloured(255,0,0)


//// calculation of MinInf  MinSup Max

StartBarindex = LastLowerBarIndex
EndBarindex = NewHigherBarIndex

StartBarindex = max(1,StartBarindex)
EndBarindex = max(1,EndBarindex)

LastLowerBarIndex = max(1,LastLowerBarIndex)
NewHigherBarIndex = max(1,NewHigherBarIndex)

StartBarSignalIndex = max(1,StartBarSignalIndex)

StartBarSignalIndex = LagAfterSignal + (EndBarindex-StartBarindex) // calculation of the real Barindex when we get the Newpeak / Newdown information : we will need it to calculate the global volume during a sequence.


hh=NewHigher
ll=LastLower
div = (hh-ll)/NbOfDiv      // thickness of the horizontal bar
i=0


//////// Fibo
fullrange = abs(hh-ll)
fibo100   = hh
fibo0     = ll
fibo236   = ll+(fullrange*0.236)
fibo382   = ll+(fullrange*0.382)
fibo500    = ll+fullrange/2
fibo618   = ll+(fullrange*0.618)
fibo764   = ll+(fullrange*0.764)
// extensions++
fibo1236  = hh +(fullrange*0.236)
fibo1382  = hh +(fullrange*0.382)
fibo1500  = hh +fullrange/2
fibo1618  = hh +(fullrange*0.618)
fibo1764  = hh +(fullrange*0.764)
fibo200   = hh + fullrange
// extensions--
fibo0236  = ll - (fullrange*0.236)
fibo0382  = ll - (fullrange*0.382)
fibo0500  = ll - fullrange/2
fibo0618  = ll - (fullrange*0.618)
fibo0764  = ll - (fullrange*0.764)
fibo00   = ll - fullrange


///support - resistance
lrangeminInf = 0
hrangeminInf = 0
lrangeminSup = 0
hrangeminSup = 0
lrangemax = 0
hrangemax = 0
MaxVol = 0
NumBarVol = 0
NumBarMaxVol = 0
NumBarMinVolSup = 0
NumBarMinVolInf = 0


volsum = summation [StartBarSignalIndex](volume)-summation [LagAfterSignal](volume)


while i<NbOfDiv do
lrange=ll+div*i
hrange=lrange+div
volbull=0
volbear=0
NumBarVol = i+1

for q = StartBarSignalIndex downto LagAfterSignal do
if close[q]>=lrange and close[q]<=hrange then
if close[q]>open[q] then
volbull=volbull+volume[q]
else
volbear=volbear+volume[q]
endif
endif
next
////bullbar = round((volbull*StartBar)/volsum)*scalefactor
////bearbar = round((volbear*StartBar)/volsum)*scalefactor
volbar = ((volbear+volbull)/volsum)*abs(StartBarSignalIndex-LagAfterSignal)*scalefactor


if i=0 then


lrangemax = lrange
hrangemax = hrange
MaxVol = volbar
NumBarMaxVol = NumBarVoL

lrangeminSup = lrange
hrangeminSup = hrange
MinVolSup = VolBar
NumBarMinVolSup = NumBarVol

lrangeminInf = lrange
hrangeminInf = hrange
MinVolInf = VolBar
NumBarMinVolInf = NumBarVol

endif


if volbar > MaxVol then
lrangemax = lrange
hrangemax = hrange
MaxVol = volbar
NumBarMaxVol = NumBarVol

if MinVolSup < MinVolInf then
lrangeminInf = lrangeminSup
hrangeminInf = hrangeminSup
MinVolInf = MinVolSup
NumBarMinVolInf = NumBarMinVolSup
endif

lrangeminSup = lrange
hrangeminSup = hrange
MinVolSup = VolBar
NumBarMinVolSup = NumBarVol

elsif volbar < MaxVol then
if volbar < MinVolSup then
lrangeminSup = lrange
hrangeminSup = hrange
MinVolSup = VolBar
NumBarMinVolSup = NumBarVol
endif

else
lrangeminInf = lrangeminInf
hrangeminInf = hrangeminInf
MinVolInf = MinVolInf
NumBarMinVolInf = NumBarMinVolInf

endif

drawrectangle(StartbarIndex,lrange,StartbarIndex+volbar,hrange) coloured(46,139,87,255)

i=i+1
wend


MaxVolumLevel = (lrangemax + hrangemax)/2
MinVolumSupLevel = (lrangeminSup + hrangeminSup)/2
MinVolumInfLevel = (lrangeminInf + hrangeminInf)/2

// option drawing the support and resistance line

if LineExtension then

DRAWHLINE((lrangemax + hrangemax)/2)coloured(0,255,0)

endif

// option checking the support and resistance line calculation

if NumbarVerif then

drawtext("#NumBarMaxVol#",StartbarIndex-1,MaxVolumLevel,Dialog,standard,10) coloured(255,0,0)
drawtext("#NumBarMinVolSup#",StartbarIndex-1,MinVolumSupLevel,Dialog,standard,10) coloured(255,0,0)
drawtext("#NumBarMinVolInf#",StartbarIndex-1,MinVolumInfLevel,Dialog,standard,10) coloured(255,0,0)

endif
//
drawtext("▼▼",StartbarIndex+2,MinVolumInfLevel,Dialog,standard,10) coloured(0,0,255)// MinInf
drawtext("▲▲",StartbarIndex+2,MinVolumSupLevel,Dialog,standard,10) coloured(0,0,255)// MinSup
drawtext("■■",StartbarIndex+2,MaxVolumLevel,Dialog,standard,10) coloured(255,0,0) // Max


// Fibo

drawsegment(StartbarIndex,fibo100,EndbarIndex,fibo100) coloured(r1,g1,b1)
drawtext("100 -",EndbarIndex-2,fibo100,Dialog,Standard,10) coloured(r,g,b)

drawsegment(EndbarIndex+1,fibo236,EndbarIndex,fibo236) coloured(r1,g1,b1)
drawtext("23.6",EndbarIndex-2,fibo236,Dialog,Standard,10) coloured(r,g,b)

drawsegment(EndbarIndex+1,fibo382,EndbarIndex,fibo382) coloured(r1,g1,b1)
drawtext("38.2",EndbarIndex-2,fibo382,Dialog,Standard,10) coloured(r,g,b)

drawsegment(EndbarIndex+1,fibo500,EndbarIndex,fibo500) coloured(r1,g1,b1)
drawtext("50",EndbarIndex-2,fibo500,Dialog,Standard,10) coloured(r,g,b)

drawsegment(EndbarIndex+1,fibo618,EndbarIndex,fibo618) coloured(r1,g1,b1)
drawtext("61.8",EndbarIndex-2,fibo618,Dialog,Standard,10) coloured(r,g,b)

drawsegment(EndbarIndex+1,fibo764,EndbarIndex,fibo764) coloured(r1,g1,b1)
drawtext("76.4",EndbarIndex-2,fibo764,Dialog,Standard,10) coloured(r,g,b)

drawsegment(StartbarIndex,fibo0,EndbarIndex,fibo0) coloured(r1,g1,b1)
drawtext("0",EndbarIndex-2,fibo0,Dialog,Standard,10) coloured(r,g,b)


// option extending Fibonacci lines to create potential takeprofits

if FiboExtension then

drawsegment (EndbarIndex,fibo200,EndbarIndex,fibo00) coloured (r1,g1,b1)

// Extensions++
drawsegment(EndbarIndex+1,fibo1236,EndbarIndex,fibo1236) coloured(0,255,0)
drawtext("+23.6",EndbarIndex-2,fibo1236,Dialog,Standard,10) coloured(0,255,0)

drawsegment(EndbarIndex+1,fibo1382,EndbarIndex,fibo1382) coloured(0,255,0)
drawtext("+38.2",EndbarIndex-2,fibo1382,Dialog,Standard,10) coloured(0,255,0)

drawsegment(EndbarIndex+1,fibo1500,EndbarIndex,fibo1500) coloured(0,255,0)
drawtext("+50",EndbarIndex-2,fibo1500,Dialog,Standard,10) coloured(0,255,0)

drawsegment(EndbarIndex+1,fibo1618,EndbarIndex,fibo1618) coloured(0,255,0)
drawtext("+61.8",EndbarIndex-2,fibo1618,Dialog,Standard,10) coloured(0,255,0)

drawsegment(EndbarIndex+1,fibo1764,EndbarIndex,fibo1764) coloured(0,255,0)
drawtext("+76.4",EndbarIndex-2,fibo1764,Dialog,Standard,10) coloured(0,255,0)

drawsegment(EndbarIndex+1,fibo200,EndbarIndex,fibo200) coloured(0,255,0)
drawtext("200",EndbarIndex-2,fibo200,Dialog,Standard,10) coloured(0,255,0)

// Extensions --
drawsegment(EndbarIndex+1,fibo0236,EndbarIndex,fibo0236) coloured(255,0,0)
drawtext("-23.6",EndbarIndex-2,fibo0236,Dialog,Standard,10) coloured(255,0,0)

drawsegment(EndbarIndex+1,fibo0382,EndbarIndex,fibo0382) coloured(255,0,0)
drawtext("-38.2",EndbarIndex-2,fibo0382,Dialog,Standard,10) coloured(255,0,0)

drawsegment(EndbarIndex+1,fibo0500,EndbarIndex,fibo0500) coloured(255,0,0)
drawtext("-50",EndbarIndex-2,fibo0500,Dialog,Standard,10) coloured(255,0,0)

drawsegment(EndbarIndex+1,fibo0618,EndbarIndex,fibo0618) coloured(255,0,0)
drawtext("-61.8",EndbarIndex-2,fibo0618,Dialog,Standard,10) coloured(255,0,0)

drawsegment(EndbarIndex+1,fibo0764,EndbarIndex,fibo0764) coloured(255,0,0)
drawtext("-76.4",EndbarIndex-2,fibo0764,Dialog,Standard,10) coloured(255,0,0)

drawsegment(EndbarIndex+1,fibo00,EndbarIndex,fibo00) coloured(255,0,0)
drawtext("-200",EndbarIndex-2,fibo00,Dialog,Standard,10) coloured(255,0,0)

endif

endif


////// ZigZag for ProOrder


if lastpoint>=0 then

if close[cp] <= lowest[2*cp+1](close)  then
NewDown = 1
Lower = close[cp]
LowCp = Low[cp]
LowerBarIndex = barindex[cp]

else
NewDown = 0
endif
endif


if NewDown then


NewLowerBarIndex=LowerBarIndex
LastHigherBarIndex = NewHigherBarIndex
Newlower = lower
LastHigher = NewHigher
LagAfterSignal = abs(barindex-NewLowerBarIndex)
lastpoint = -1

drawsegment (LastHigherBarIndex,lasthigher,NewLowerBarIndex,NewLower) coloured (0,0,255)
drawsegment (LastLowerBarIndex,Newlower,LastLowerBarIndex,Lasthigher) coloured (r1,g1,b1)
drawtext("▲", LowerBarIndex, LowCp) coloured (255,0,0)

//// calculation MinInf MinSup Max
EndBarindex = NewLowerBarIndex
StartBarindex = LastHigherBarIndex

StartBarindex = max(1,StartBarindex)
Endbarindex = max(1,Endbarindex)
StartBarSignalIndex = max(1,StartBarSignalIndex)


StartBarSignalIndex = LagAfterSignal + (EndBarindex-StartBarindex) // calculation of the real Barindex when we get the Newpeak / Newdown information : we will need it to calculate the global volume during a sequence.


hh=Lasthigher
ll=Newlower
div = (hh-ll)/NbOfDiv      // thickness of the horizontal bar
i=0


///Fibo

fullrange = abs(hh-ll)
fibo100   = ll
fibo0     = hh
fibo236   = hh-(fullrange*0.236)
fibo382   = hh-(fullrange*0.382)
fibo500    = hh-fullrange/2
fibo618   = hh-(fullrange*0.618)
fibo764   = hh-(fullrange*0.764)
// extensions--
fibo0236  = ll - (fullrange*0.236)
fibo0382  = ll - (fullrange*0.382)
fibo0500  = ll - fullrange/2
fibo0618  = ll - (fullrange*0.618)
fibo0764  = ll - (fullrange*0.764)
fibo00    = ll - fullrange
// extensions++
fibo1236  = hh +(fullrange*0.236)
fibo1382  = hh +(fullrange*0.382)
fibo1500  = hh +fullrange/2
fibo1618  = hh +(fullrange*0.618)
fibo1764  = hh +(fullrange*0.764)
fibo200   = hh + fullrange

//////////////

volsum = summation [StartBarSignalIndex](volume)-summation [LagAfterSignal](volume)


while i<NbOfDiv do
lrange=ll+div*i
hrange=lrange+div
volbull=0
volbear=0
NumBarVol = i+1

for q = StartBarSignalIndex downto LagAfterSignal do
if close[q]>=lrange and close[q]<=hrange then
if close[q]>open[q] then
volbull=volbull+volume[q]
else
volbear=volbear+volume[q]
endif
endif
next
//bullbar = round((volbull*StartBar)/volsum)*scalefactor
//bearbar = round((volbear*StartBar)/volsum)*scalefactor
volbar = (volbear+volbull)/volsum *abs(StartBarSignalIndex-LagAfterSignal)*scalefactor // /scalefactor


if i=0 then

lrangemax = lrange
hrangemax = hrange
MaxVol = volbar
NumBarMaxVol = NumBarVoL

lrangeminSup = lrange
hrangeminSup = hrange
MinVolSup = VolBar
NumBarMinVolSup = NumBarVol

lrangeminInf = lrange
hrangeminInf = hrange
MinVolInf = VolBar
NumBarMinVolInf = NumBarVol

endif


if volbar > MaxVol then
lrangemax = lrange
hrangemax = hrange
MaxVol = volbar


if MinVolSup < MinVolInf then
lrangeminInf = lrangeminSup
hrangeminInf = hrangeminSup
MinVolInf = MinVolSup
NumBarMinVolInf = NumBarMinVolSup
endif

lrangeminSup = lrange
hrangeminSup = hrange
MinVolSup = VolBar
NumBarMinVolSup = NumBarVol

elsif volbar < MaxVol then
if volbar < MinVolSup then
lrangeminSup = lrange
hrangeminSup = hrange
MinVolSup = VolBar
NumBarMinVolSup = NumBarVol
endif

else
lrangeminInf = lrangeminInf
hrangeminInf = hrangeminInf
MinVolInf = MinVolInf
NumBarMinVolInf = NumBarMinVolInf

endif


drawrectangle(StartbarIndex,lrange,StartbarIndex+volbar,hrange) coloured(46,139,87,255)

i=i+1
wend

MaxVolumLevel = (lrangemax + hrangemax)/2
MinVolumSupLevel = (lrangeminSup + hrangeminSup)/2
MinVolumInfLevel = (lrangeminInf + hrangeminInf)/2


if LineExtension then

DRAWHLINE((lrangemax + hrangemax)/2)coloured(255,0,0)

endif
//
if NumbarVerif then

drawtext("#NumBarMaxVol#",StartbarIndex-1,MaxVolumLevel,Dialog,standard,10) coloured(255,0,0)
drawtext("#NumBarMinVolSup#",StartbarIndex-1,MinVolumSupLevel,Dialog,standard,10) coloured(255,0,0)
drawtext("#NumBarMinVolInf#",StartbarIndex-1,MinVolumInfLevel,Dialog,standard,10) coloured(255,0,0)

endif
//
drawtext("▼▼",StartbarIndex+2,MinVolumInfLevel,Dialog,standard,10) coloured(0,0,255)// MinInf
drawtext("▲▲",StartbarIndex+2,MinVolumSupLevel,Dialog,standard,10) coloured(0,0,255)// MinSup
drawtext("■■",StartbarIndex+2,MaxVolumLevel,Dialog,standard,10) coloured(255,0,0) // Max


//Fibo

drawsegment(StartbarIndex,fibo100,EndbarIndex,fibo100) coloured(r1,g1,b1)
drawtext("100",EndbarIndex-2,fibo100,Dialog,Standard,10) coloured(r,g,b)

drawsegment(EndbarIndex+1,fibo236,EndbarIndex,fibo236) coloured(r1,g1,b1)
drawtext("23.6",EndbarIndex-2,fibo236,Dialog,Standard,10) coloured(r,g,b)

drawsegment(EndbarIndex+1,fibo382,EndbarIndex,fibo382) coloured(r1,g1,b1)
drawtext("38.2",EndbarIndex-2,fibo382,Dialog,Standard,10) coloured(r,g,b)

drawsegment(EndbarIndex+1,fibo500,EndbarIndex,fibo500) coloured(r1,g1,b1)
drawtext("50",EndbarIndex-2,fibo500,Dialog,Standard,10) coloured(r,g,b)

drawsegment(EndbarIndex+1,fibo618,EndbarIndex,fibo618) coloured(r1,g1,b1)
drawtext("61.8",EndbarIndex-2,fibo618,Dialog,Standard,10) coloured(r,g,b)

drawsegment(EndbarIndex+1,fibo764,EndbarIndex,fibo764) coloured(r1,g1,b1)
drawtext("76.4",EndbarIndex-2,fibo764,Dialog,Standard,10) coloured(r,g,b)

drawsegment(StartbarIndex,fibo0,EndbarIndex,fibo0) coloured(r1,g1,b1)
drawtext("0",EndbarIndex-2,fibo0,Dialog,Standard,10) coloured(r,g,b)

If FiboExtension then

// Extensions++

drawsegment (EndbarIndex,fibo200,EndbarIndex,fibo00) coloured (r1,g1,b1)

drawsegment(EndbarIndex+1,fibo1236,EndbarIndex,fibo1236) coloured(0,255,0)
drawtext("+23.6",EndbarIndex-2,fibo1236,Dialog,Standard,10) coloured(0,255,0)

drawsegment(EndbarIndex+1,fibo1382,EndbarIndex,fibo1382) coloured(0,255,0)
drawtext("+38.2",EndbarIndex-2,fibo1382,Dialog,Standard,10) coloured(0,255,0)

drawsegment(EndbarIndex+1,fibo1500,EndbarIndex,fibo1500) coloured(0,255,0)
drawtext("+50",EndbarIndex-2,fibo1500,Dialog,Standard,10) coloured(0,255,0)

drawsegment(EndbarIndex+1,fibo1618,EndbarIndex,fibo1618) coloured(0,255,0)
drawtext("+61.8",EndbarIndex-2,fibo1618,Dialog,Standard,10) coloured(0,255,0)

drawsegment(EndbarIndex+1,fibo1764,EndbarIndex,fibo1764) coloured(0,255,0)
drawtext("+76.4",EndbarIndex-2,fibo1764,Dialog,Standard,10) coloured(0,255,0)

drawsegment(EndbarIndex+1,fibo200,EndbarIndex,fibo200) coloured(0,255,0)
drawtext("200",EndbarIndex-2,fibo200,Dialog,Standard,10) coloured(0,255,0)

// Extensions --
drawsegment(EndbarIndex+1,fibo0236,EndbarIndex,fibo0236) coloured(255,0,0)
drawtext("-23.6",EndbarIndex-2,fibo0236,Dialog,Standard,10) coloured(255,0,0)

drawsegment(EndbarIndex+1,fibo0382,EndbarIndex,fibo0382) coloured(255,0,0)
drawtext("-38.2",EndbarIndex-2,fibo0382,Dialog,Standard,10) coloured(255,0,0)

drawsegment(EndbarIndex+1,fibo0500,EndbarIndex,fibo0500) coloured(255,0,0)
drawtext("-50",EndbarIndex-2,fibo0500,Dialog,Standard,10) coloured(255,0,0)

drawsegment(EndbarIndex+1,fibo0618,EndbarIndex,fibo0618) coloured(255,0,0)
drawtext("-61.8",EndbarIndex-2,fibo0618,Dialog,Standard,10) coloured(255,0,0)

drawsegment(EndbarIndex+1,fibo0764,EndbarIndex,fibo0764) coloured(255,0,0)
drawtext("-76.4",EndbarIndex-2,fibo0764,Dialog,Standard,10) coloured(255,0,0)

drawsegment(EndbarIndex+1,fibo00,EndbarIndex,fibo00) coloured(255,0,0)
drawtext("-200",EndbarIndex-2,fibo00,Dialog,Standard,10) coloured(255,0,0)

endif

endif


return


//Rest of the code of Nicolas if you want to create intermadiate ZigZag

////---mino zigzag points
//if high[round(cp/2)] >= highest[cp+1](high) then
//LNewPeak = 1
//else
//LNewPeak = 0
//endif
//
//if low[round(cp/2)] <= lowest[cp+1](low)  then
//NewDownL = -1
//else
//NewDownL = 0
//endif
//
//if LNewPeak = 1 then
//LNewHigher = high[round(cp/2)]
//NewPeakigherBarIndex = barindex[round(cp/2)]
//endif
//
//if NewDownL = -1 then
//LBOTy = low[round(cp/2)]
//LBOTx = barindex[round(cp/2)]
//endif
//
//if LNewPeak>0 then
//DRAWTEXT("º",NewPeakigherBarIndex,LNewHigher+ATR/2,Dialog,Bold,20) coloured(200,0,0)
//endif
//if NewDownL<0 then
//DRAWTEXT("º",LBOTx,LBOTy-ATR/2,Dialog,Bold,20) coloured(0,200,0)
//endif
Comments
You must be logged in to post a comment.
Pleasure ! Please let us know if you make good trades with it and if you see improvements we could add !

I am curious to try it how, however I get an error message for line 47 and 48 - drawsegment, whereas PRT has no issues with drawtext. Do you have any hints? Thank you!

Ottimo, complimenti per il grande lavoro

Pleasure ! Please let us know if you make good trades with it and if you see improvements we could add !

Hello , je viens de tenter d'installer ton indicateur ZIGZAG FIZIVOL , mais ça ne fonctionne pas car je ne peux pas cocher "LineExtension" et "FiboExtension" car ll fenêtre Propriétés de l'indicateur ne le propose pas . De plus , quelle Valeur donnes-tu habituellement pour "NumBarVérif" ? Merci par avance pour ta réponse Pasreb 03 02 2022

Hello, Is there any user guide for this interesting indicator ? Thanks in advance



Bonjour J'ai essayé de mettre en place dans PRT mais j'ai un message d'erreur? "Erreur de syntaxe: Veuillez définir la variable suivante: CP Veuillez définir la variable suivante: nbofdiv Veuillez définir la variable suivante: scalefactor Veuillez définir la variable suivante: lineextention Veuillez définir la variable suivante: numbarverif Veuillez définir la variable suivante: fiboextention" QQ " un at-il la solution? Merci pour l'aide



This implement In PRT is one of the greatest work on this site, i hope the IG volume data feed is good enough to use this tool, all the volume profile based indicators in PRT are one of the most lack of this platform, and your job deserves all my gratitude. My strategy (on DAX) is always, entry on a retracement (limit order near an opening level) on a POC level after a brakeout on TF1-5min, only if there is a wide volume lack, TakeProfit on the next POC and trailingstop behind the next opening levels. P.s. Can you suggest me a convenient use of a lookback parameter according to exactly what it does in your code? Thank you Kris


Bonjour, Bonjour, comment puis-je créer un screener basé sur cet indicateur, qui affiche les résultats chaque fois qu'un nouveau signe ▲ est créé. D'avance merci ! :-)