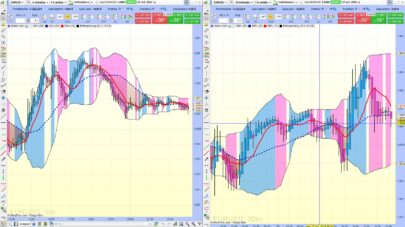
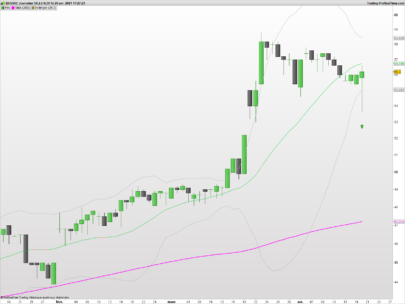
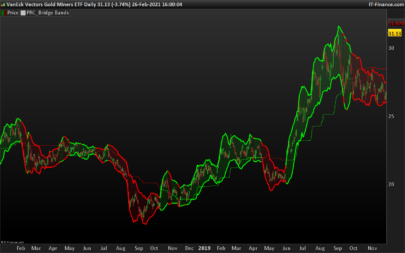
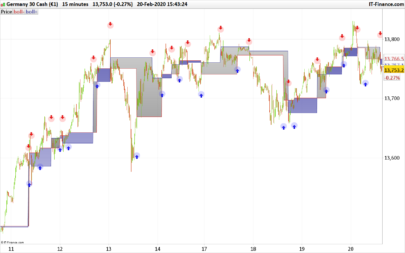
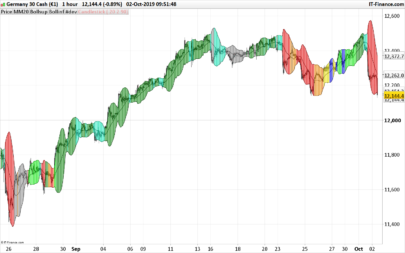
This screener attempt to fetch stocks where the Bollinger Bands width has been decreasing on the daily timeframe (5 days decreased in the same row) and reached a new lowest value over the last 24 weekly periods (approximately 6 months).
Combining with other filters and on specific equity frame, it could retrieve the most relevant stocks that potentially felt asleep before an heavy price expansion.
|
1 2 3 4 5 6 7 8 9 10 11 12 13 |
TIMEFRAME(WEEKLY) UpperBandW = BollingerUp[20](close) LowerBandW = BollingerDown[20](close) BollingerDiffW = UpperBandW-LowerBandW condition1 = BollingerDiffW<=Lowest[24](BollingerDiffW) TIMEFRAME(DAILY) UpperBandD = BollingerUp[20](close) LowerBandD = BollingerDown[20](close) BollingerDiffD = UpperBandD-LowerBandD condition2 = BollingerDiffD[5]>BollingerDiffD[4] AND BollingerDiffD[4]>BollingerDiffD[3] AND BollingerDiffD[3]>BollingerDiffD[2] AND BollingerDiffD[2]>BollingerDiffD[1] SCREENER [condition1 AND condition2] |
Share this
No information on this site is investment advice or a solicitation to buy or sell any financial instrument. Past performance is not indicative of future results. Trading may expose you to risk of loss greater than your deposits and is only suitable for experienced investors who have sufficient financial means to bear such risk.
ProRealTime ITF files and other attachments :PRC is also on YouTube, subscribe to our channel for exclusive content and tutorials


