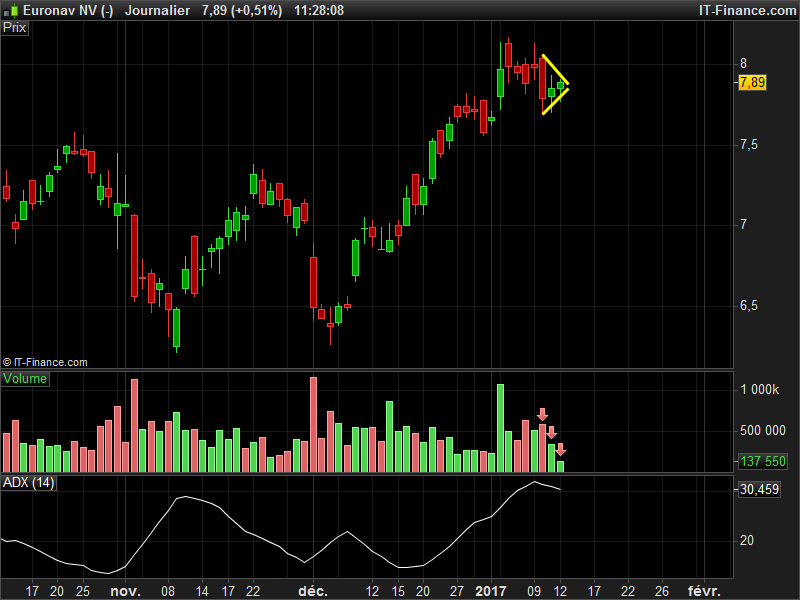
The boomer pattern is a special graphic configuration formed by three bars in sequence, of which the last two are inside the previous one. In practice the first bar encloses the two successive which have minimum and maximum respectively upper and lower than the previous.
Ultimately, after the first bar, the pattern contain two “inside days”, days when the minimum and the maximum grow without exceeding the values of the previous range.
That graphic situation indicates a progressive compression of volatility which normally gives rise to an explosion of significant quantities prices.
This pattern identify a price squeeze consisting of three bars in the sequence having the characteristics described above which is a prelude to a subsequent volatility of explosion. However this pattern of course not allow in any way to predict the direction of the breakout, if not relying on continuation pattern or reversal of technical analysis, such as the triangles that are formed on a maximum or a minimum period of rather than in the middle of a trend in place.
The pattern, results in a triangular shape which can be of a reversal or continuation of the main trend.
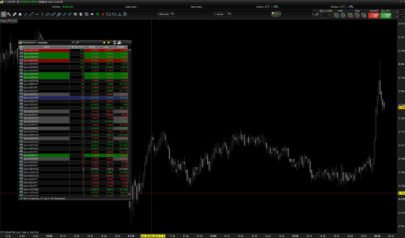
In this ProScreener code, an ADX filter is added to know if the instrument is trending (ADX value must be above 25 at least).
I also add a DI+ and DI- comparison (above / below), to find what is the actual trend and give an information of what would be the direction of the triangle breakout : bullish or bearish. This is the sorted column criteria: 1 = potential bullish explosion to come, -1=bearish one).
|
1 2 3 4 5 6 7 8 9 10 11 12 13 14 15 16 17 18 19 20 |
//PRC_Boomer pattern screener | screener //11.01.2017 //Nicolas @ www.prorealcode.com //Sharing ProRealTime knowledge c = summation[2](high<high[1] and low>low[1])=2 v = summation[2](volume<volume[1])=2 a = adx[14]>=25 d = DIplus[14]>DIminus[14] if d then //bullish trend direction = 1 else //bearish trend direction = -1 endif boomer = c and v and a screener [boomer] (direction as "Trend 1=bull/-1=bear") |
Share this
No information on this site is investment advice or a solicitation to buy or sell any financial instrument. Past performance is not indicative of future results. Trading may expose you to risk of loss greater than your deposits and is only suitable for experienced investors who have sufficient financial means to bear such risk.
ProRealTime ITF files and other attachments :
Find other exclusive trading pro-tools on ![]()
PRC is also on YouTube, subscribe to our channel for exclusive content and tutorials


I created the indicator
//Boomer pattern indicator
c = summation[2](high<high[1] and low>low[1])=2
v = summation[2](volume<volume[1])=2
a = adx[14]>=25
d = DIplus[14]>DIminus[14]
e = DIplus[14]<DIminus[14]
boomerlong = c and v and a and d
boomershort = c and v and a and e
//bullish trend
if boomerlong then
DRAWARROWUP(barindex, low- low*0.003) coloured(0,255,0)
DRAWcandle(open, high, low, close) coloured(0,255,2)
DRAWTEXT(\"Boomer Long\", barindex, high+high*0.03) coloured(255,255,2)
endif
//bearish trend
if boomershort then
DRAWARROWdown(barindex, high+ high*0.003) coloured(255,0,0)
DRAWcandle(open, high, low, close) coloured(255,0,0)
DRAWTEXT(\"Boomer Short\", barindex, low-low*0.03) coloured(255,255,2)
endif
return boomerlong or boomershort
Thanks for sharing it here! 😉
Hi
Can’t get the indicator to work. “Syntax error line 13 character 12”
Can somebody help me?
Not an indicator but a screener.
Nicolas! You screener works perfekt, thank you. But theI meant the indicator and the code gianlox posted.
Oh sorry! I think you are still using the 10.2 version of the platform that don’t allow these new graphical instructions, that’s the reason why you get this syntax error.
Hi Nicolas, your screeners are great thanks heaps! I am just getting used to PRT. Any chance you have some for: Cup and Handle Pattern, High tight flag and (VCP) volatility contraction patterns…..??
Why not, please add a query as a new topic in the screeners forum.