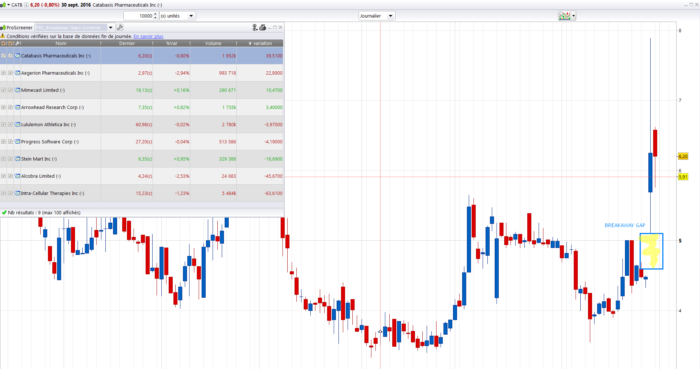
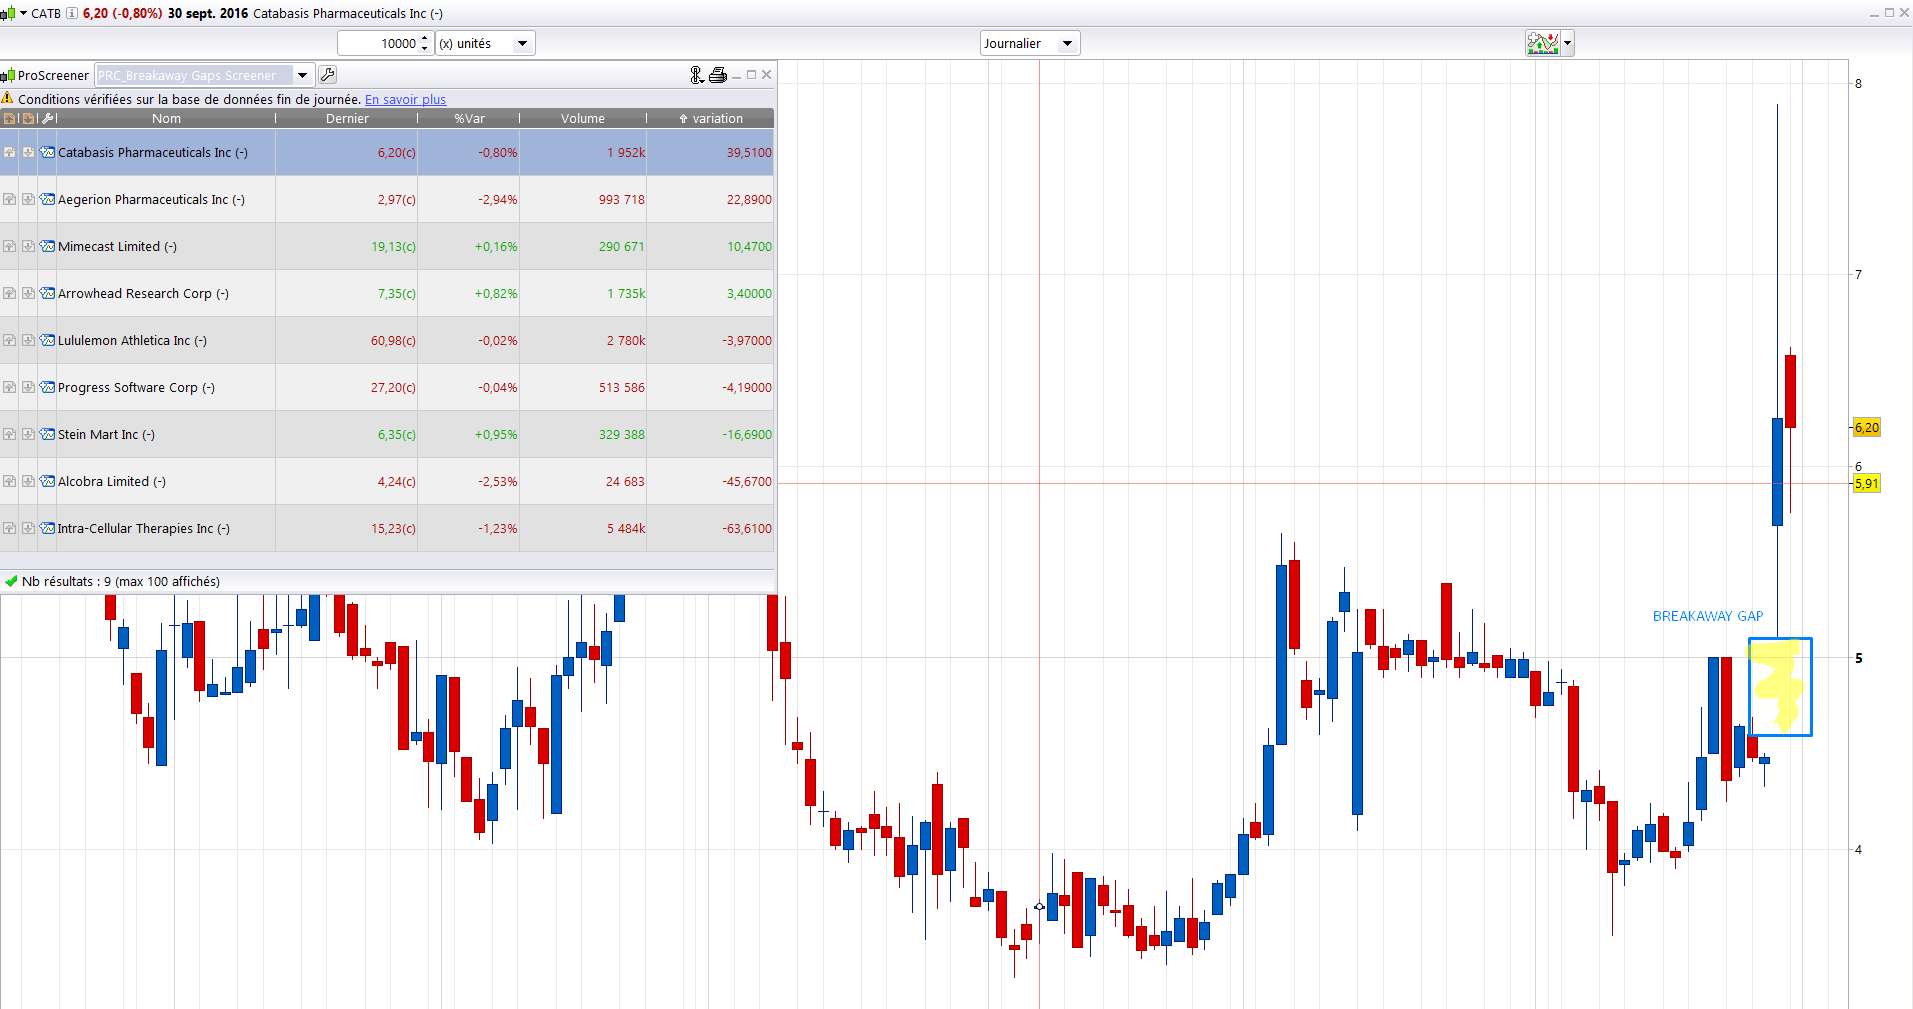
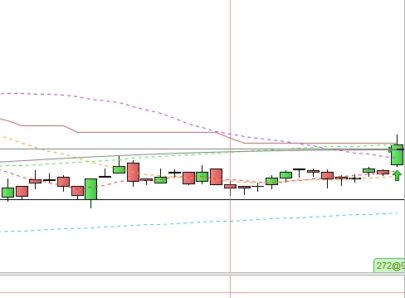
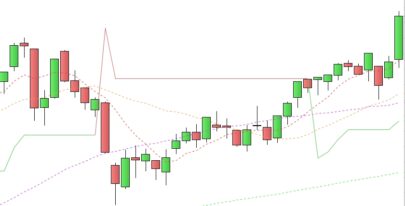
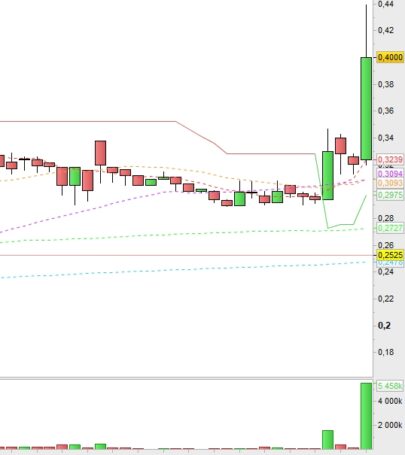
A breakaway gap screener find the gap between a new open and a previous close that is in convergence with a significant volume increase at the same time. A breakaway gap often signify a continuous of a trend. Sometimes an exhaustion of the current trend can happen some days later the gap detection.
This code can be adapted to any other values of average volume comparison and breakout of the highest high and lowest low period.
|
1 2 3 4 5 6 7 8 9 10 11 12 13 14 15 16 |
//PRC_Breakaway Gaps screener | screener //03.10.2016 //Nicolas @ www.prorealcode.com //Sharing ProRealTime knowledge hh = highest[10](high) ll = lowest[10](low) c = open[0] vol = Volume/Volume[1]>1.5 and average[90](volume)>100000 breakup = variation>=3 and c>hh[1] breakdown = variation<=-3 and c<ll[1] SCREENER [vol and (breakup or breakdown)] (Variation as "variation") |
Share this
No information on this site is investment advice or a solicitation to buy or sell any financial instrument. Past performance is not indicative of future results. Trading may expose you to risk of loss greater than your deposits and is only suitable for experienced investors who have sufficient financial means to bear such risk.
ProRealTime ITF files and other attachments :PRC is also on YouTube, subscribe to our channel for exclusive content and tutorials







hi,
can we have more explanations please ? about parameters and time unit ?
thanks
Line 10: Volume of current candlestick must be at least 1.5 higher than the previous one and the average 90 days Volume must be at least more than 100.000
Line 12 & 13: Test of the current candlestick, test the gap between today’s Open and last 10 days Highest high or Lowest low, today variation must be at least 3% too.
Bonjour Nicolas je viens d’essayer ce screener mais j’obtiens des résultats curieux .Aujourd’hui 2 valeurs sortent Renault et Génomic vision pourtant elles ne font pas de gap. Que se passe t il? merci
Décalage si compte gratuit fin de journée ?