This indicator uses a zigzag indicator to measure swing highs and lows. It does so by using ATR instead of % in the zigzag. If the close is beyond the high or low, the instrument will pop up in the screener list for the next 7 bars.
|
1 2 3 4 5 6 7 8 9 10 11 12 13 14 15 16 17 18 19 20 21 22 23 24 |
//zigzag indicator ind1 = ZigZagPoint[2*averagetruerange[200]](close) //high boundary if ind1[1] > ind1 and ind1[2]<ind1[1] then ind2 = highest[5](high) endif //low boundary if ind1[1] < ind1 and ind1[2]>ind1[1] then ind3 = lowest[5](low) endif //proscreener conditions //upside breakout c1 = summation[7](ind1 CROSSES OVER ind2) //downside breakout c2 = summation[7](ind1 CROSSES UNDER ind3) //sorting criterium criteria = RSI[14](close) SCREENER[c1 OR c2] (criteria AS "RSI") |
Share this
No information on this site is investment advice or a solicitation to buy or sell any financial instrument. Past performance is not indicative of future results. Trading may expose you to risk of loss greater than your deposits and is only suitable for experienced investors who have sufficient financial means to bear such risk.
ProRealTime ITF files and other attachments :PRC is also on YouTube, subscribe to our channel for exclusive content and tutorials
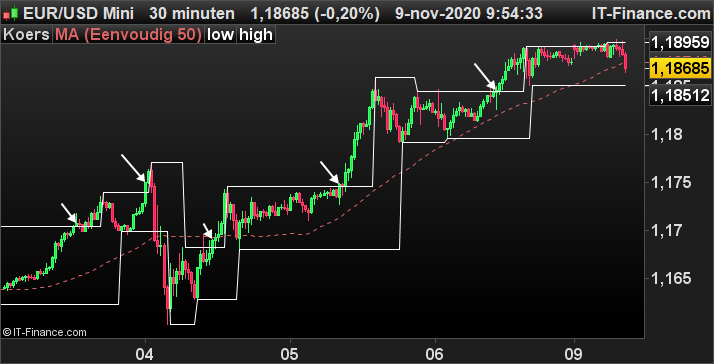



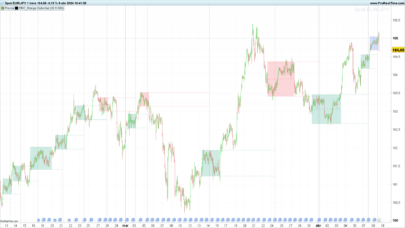
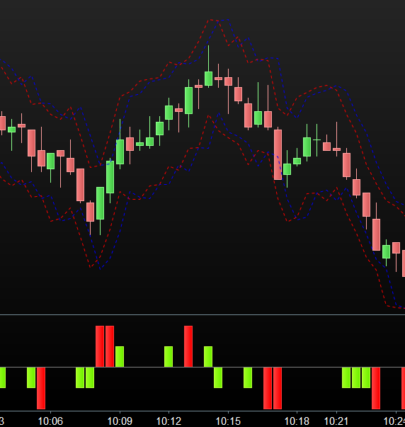
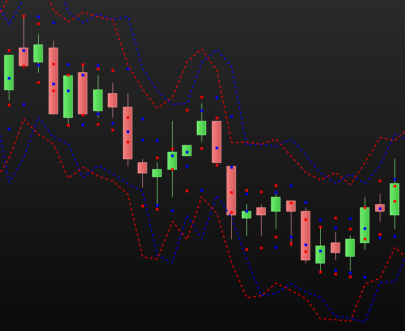

Nice job, Quel est l’indicateur qui permet d’avoir les bandes blanches rectangulaires?
@DIOS : very simple :
ind1 = ZigZagPoint[2*averagetruerange[200]](close)
//high boundary
if ind1[1] > ind1 and ind1[2]<ind1[1] then
ind2 = highest[5](high)
endif
//low boundary
if ind1[1] ind1[1] then
ind3 = lowest[5](low)
endif
return ind2 as “low”, ind3 as “high”
Hello, la ligne 9 ,11,13 me sorte en erreur?
@DIOS: take the first part of the code, until the proscreener conditions and return ind2 as high and ind3 as low
C’est bon j’ai trouvé, ++
Hello, would you be so kind, tried to figure your comment out – sorry for asking, i don’t understate it…
Result
ind1 = ZigZagPoint[2*averagetruerange[200]](close)
//high boundary
if ind1[1] > ind1 and ind1[2]<ind1[1] then
ind2 = highest[5](high)
endif
//low boundary
if ind1[1] ind1[1] then
ind3 = lowest[5](low)
endif
return ind2 as “high”, ind3 as “low”
What ist wrong, thanks in advance
Dear Seb, would be greatful if you could addtionally post the Indicator. Thanks in advance for your help. regards
@Equity: the low boundary part should be this, as in the Proscreener code:
//low boundary
if ind1[1] ind1[1] then
ind3 = lowest[5](low)
endif
Bonsoir, j’aime bcp l’idée, merci pour le code. Je l’utilisais sur la version 10.3 sans problème, je viens de passer à la version 11.1, qq chose ne fonctionne plus, on dirait qu’il ne prend pas en compte de calcul du ind1 et donc du zigzag correctement. Si je mets une valeur fixe comme argument du zigzag cela fonctionne bien. Il n’aime pas recalculer le averagetruerange sur les 200 dernières periodes à chaque fois… étrange. Si vous avez une idée, elle est la bienvenue. Merci
Tout fonctionne pour moi en Daily ou Weekly, sur les listes NYSE et NASDAQ, des dizaines de retour.
Bonjour,
je n’y arrive pas 🙁
@DIOS, pourrais-tu nous founir le programme ou fichier, merci
J’ai reussi a creer l’indicateur mais ca m’affiche tout simplement une ligne
//zigzag indicator
ind1 = ZigZagPoint[2*averagetruerange[200]](close)
//high boundary
if ind1[1] > ind1 and ind1[2]<ind1[1] then
ind2 = highest[5](high)
endif
//low boundary
if ind1[1] ind1[1] then
ind3 = lowest[5](low)
endif
return ind2 as “low”, ind3 as “high”
la valeur du zigzag est peut être trop grande par rapport à l’UT ou l’instrument choisit !
Merci, étrange… j’ai le meme problème de ligne décrit plus haut (pour l’indicateur). J’ai mis 2*averagetruerange[200] dans une variable que je vois bien évoluer au fil du temps, mais ind1 reste une ligne à légère croissance tout le long de l’historique… ind2 et ind3 restent donc bien sur à 0 tout le long car ind 1 ne bouge pas…
Juste por être sur de comment fonctionne le code, à chaque bar 2*averagetruerange[200] est recalculé donc zigzag aussi. Le dernier affichage est se base sur le zigzag du dernier 2*averagetruerange[200] calculé, n’est ce pas ?
Sur mon dernier calcul j’ai une valeur de 2*averagetruerange[200] à 396 pour un indice à 11 905 (nasdaq daily), et bien sur si je mets la variable de zigzag fixe à 396 dans le code ca marche 🙁
merci pour ces infos mais je comprends pas tout 🙁 Quelle valuer faut-il changer, comment la calculer,…..
Difficile de t’apporter une réponse, car le code présente un problème chez moi que je ne comprends pas.
Pour que cela fonctionne, je suis obligé de remplacer la variable 2*averagetruerange[200] par sa dernière valeur fixe pour avoir un bon affichage. Malheureusement cette valeur va dépendre de l’instrument que tu choisis, donc je dois le modifier pour chaque instrument. Mais logiquement cela doit fonctionner sans faire cela, le code original est bon (ca marche chez plusieurs personnes), perso quand je le fais tourner sur la verison 10.6 de PRT ca marche à tous les coups…
@Steph, quand tu parles de valeur, le 200 tu le remplaces par quoi exactement ?
Le 200 ne bouge pas, il corespond au nombre de bars du passé sur lequel on calcule le averagetruerange. Je remplace tout l’élement 2*averagetruerange[200] -qui sert d’argument au calcul du zigzag dans le code- par une valeur. Dans mon example le averagetruerange sur les 200 dernieres bars est de 198, donc x2 = 396. C’est ce 396 que je mets dans le zigzag.
En terme de lignes de codes, ca ressemble a quoi ?
//ind1 = ZigZagPoint[2*averagetruerange[200]](close)
avr = 3 //3%
ind1 = ZigZag[avr](close)
//high boundary
if ind1[1] > ind1 and ind1[2]<ind1[1] then
ind2 = highest[5](high)
endif
//low boundary
if ind1[1] ind1[1] then
ind3 = lowest[5](low)
endif
return ind2 as "low", ind3 as "high"
@Steph
un grand merci pour ton aide mais 🙁
J’ai copier le code tel quel mais cependant j’ai 3 erreurs aux lignes 13, 15 ,17 !? J’ai supprime l’un des ind1[1] sur cette ligne if ind1[1] ind1[1] then et plus d’erreur.
La courbe superieure se dessine bien mais la courbe inferieur n’a pas la meme formel : pas de phenomene de parallelisme rectiligne !
De plus peux-tu m’en dire un peu plus sur le avr = 3 //3% : a quoi ca correspond
Et est ce que cet indicateur est utilisable sur tous les UT ?
Je n’ai pas réussi à faire fonctionner l’indicateur avec le code fourni en commentaire sur PRT 11.1.