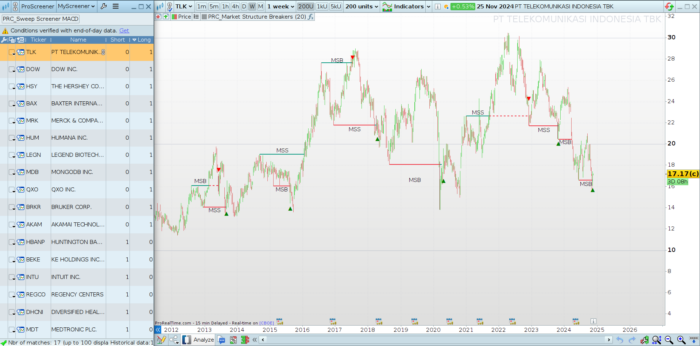
A few months ago, we shared an indicator on ProRealCode called the Market Structure Breakers Indicator (you can read the full article here). This indicator was designed to identify breaks in market structures, both bullish and bearish, based on pivots and key points on price charts.
Today, we take it a step further with the development of a screener that uses this logic of breakouts to automatically scan markets and find assets meeting these conditions. This screener allows traders to detect trading opportunities in real time, simplifying decision-making.
In the following sections, we’ll explain how to configure and use this screener, detail its internal logic, and provide the full code so you can implement and adapt it to your needs.
Screener Configuration
The Market Structure Breakers screener is designed to identify market structure breakouts using logic based on pivots and key levels. It identifies both bullish and bearish breakouts, assigning “Long” or “Short” signals accordingly.
Configurable Parameter: length
length: This parameter determines the number of bars used to calculate pivots and validate breakouts. By default, it is set to20, but you can adjust it depending on the timeframe or behavior of the analyzed asset.
Signal Conditions
- “Long” Signal (Bullish Breakout): Generated when the price breaks through a previous bearish structure, indicating a possible shift toward an uptrend.
- “Short” Signal (Bearish Breakout): Triggered when the price breaks through a previous bullish structure, suggesting a potential move toward a downtrend.
These configurations allow the screener to adapt to various strategies and trading styles, whether intraday, swing, or long-term positions.
How the Screener Works
The Market Structure Breakers screener is based on a structured logic that combines pivots, market structures, and key breakouts to generate precise signals. Here’s how it works:
Identifying Pivots
- For bullish structures (Bullish Breaker), high pivots are detected if:
- The current high is lower than a reference value (
high[length]). - This reference value is the highest high within the last
lengthperiods. - This high is higher than the maximum from an earlier period (
highest[length](high)[length+1]).
- The current high is lower than a reference value (
- For bearish structures (Bearish Breaker), low pivots are identified if:
- The current low is higher than a reference value (
low[length]). - The lowest low within the last
lengthperiods is above the low of an earlier period.
- The current low is higher than a reference value (
Testing Market Structures
- Bullish Structures:
- Once a high pivot is identified, it validates if the current close (
close) is higher than the most recent high pivot ($ph). - If true, the breakout level is stored, and a bullish continuation signal is triggered.
- Once a high pivot is identified, it validates if the current close (
- Bearish Structures:
- Similarly, it checks if the current close is below the most recent low pivot (
$pl). - If this condition is met, a bearish breakout signal is generated.
- Similarly, it checks if the current close is below the most recent low pivot (
Detecting Breakouts
- The screener constantly evaluates for key breakouts:
- For bullish breakouts, it detects when the close is above the structure level while the open remains below it.
- For bearish breakouts, the opposite occurs: the close is below, and the open is above the relevant level.
Generating Signals
- The screener uses the variables
checkupandcheckdwto mark bullish and bearish breakouts, respectively:checkup: Indicates a bullish breakout (“Long”).checkdw: Indicates a bearish breakout (“Short”).
- These signals are evaluated and displayed in real time, allowing for data-driven decision-making.
Screener Code
Below is the full code for the Market Structure Breakers screener, including comments for easier understanding and implementation in ProRealTime.
|
1 2 3 4 5 6 7 8 9 10 11 12 13 14 15 16 17 18 19 20 21 22 23 24 25 26 27 28 29 30 31 32 33 34 35 36 37 38 39 40 41 42 43 44 45 46 47 48 49 50 51 52 53 |
//SRC_Market Structure Breakers //version = 0 //26.11.2024 //Iván González @ www.prorealcode.com //Sharing ProRealTime knowledge //---------------------Inputs------------------------------ length = 20 //----------------------------------------------------------// //----------------Bullish Breaker---------------------------// //----------------------------------------------------------// //-----Calculate pivots high------------------------------------------ if high < high[length] and highest[length](high)<high[length] and high[length]>highest[length](high)[length+1] then $ph[lastset($ph)+1]=high[length] $phx[lastset($phx)+1]=barindex[length] phcross = 0 endif //-----Test for bullish market structure-------------------- if close > $ph[max(0,lastset($ph))] and not phcross then $lasty2[lastset($lasty2)+1] = $ph[max(0,lastset($ph))] $lastx2[lastset($lastx2)+1] = barindex breakdown = 0 checkup = 0 phcross = 1 endif //------Iterate trough existing bullish structures and test for breaks if close < $lasty2[max(0,lastset($lasty2))] and open > $lasty2[max(0,lastset($lasty2))] and breakdown=0 then breakdown = 1 checkup = 1 endif //----------------------------------------------------------// //----------------Bearish Breaker---------------------------// //----------------------------------------------------------// //-----Calculate pivots low------------------------------------------ if low > low[length] and lowest[length](low) > low[length] and low[length] < lowest[length](low)[length+1] then $pl[lastset($pl)+1] = low[length] $plx[lastset($plx)+1] = barindex[length] plcross = 0 endif //--------------------------------------------------------- //-----Test for bearish market structure-------------------- if close < $pl[max(0,lastset($pl))] and not plcross then $lasty[lastset($lasty)+1]=$pl[max(0,lastset($pl))] $lastx[lastset($lastx)+1]=barindex plcross=1 breakup=0 checkdw=0 endif //------Iterate trough existing bearish structures and test for breaks if close > $lasty[max(0,lastset($lasty))] and open < $lasty[max(0,lastset($lasty))] and breakup=0 then breakup = 1 checkdw = 1 endif screener[(checkup and checkup[1]=0) or (checkdw and checkdw[1]=0)]((checkup and checkup[1]=0) as "Short", (checkdw and checkdw[1]=0) as "Long") |
Conclusion
The Market Structure Breakers screener is a powerful tool for detecting key market structure breakouts, providing clear, data-driven signals. Building upon the original indicator, this screener automates breakout detection and displays real-time results, enabling swift action.
Its flexibility makes it suitable for various strategies, from intraday trading to long-term investing. Furthermore, its high customizability allows you to tailor it to your specific needs by adjusting the length parameter or combining it with other indicators for enhanced precision.
We invite you to try this screener on your ProRealTime platform and share your experiences with the community. Remember, the best way to refine a tool is through usage and feedback.
Share this
No information on this site is investment advice or a solicitation to buy or sell any financial instrument. Past performance is not indicative of future results. Trading may expose you to risk of loss greater than your deposits and is only suitable for experienced investors who have sufficient financial means to bear such risk.
ProRealTime ITF files and other attachments :PRC is also on YouTube, subscribe to our channel for exclusive content and tutorials


