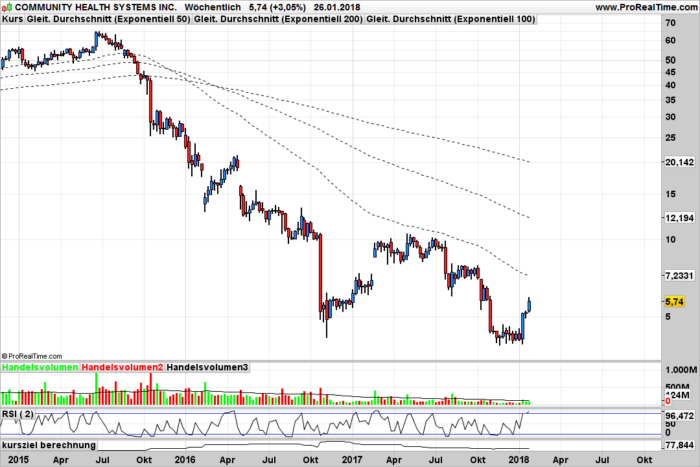
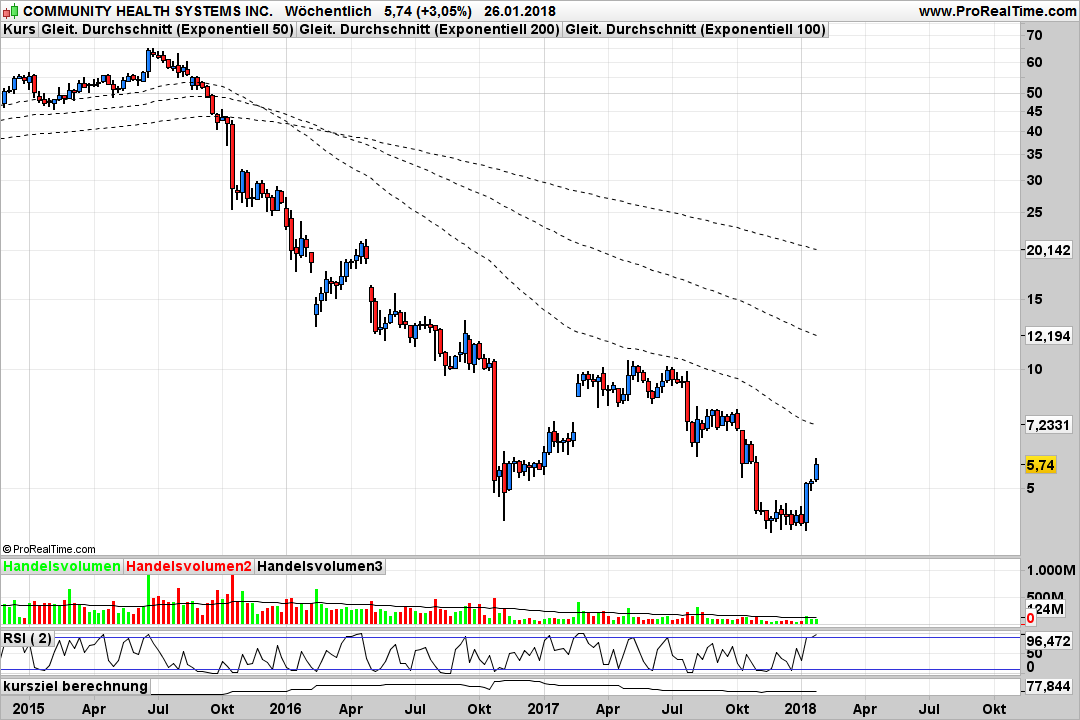
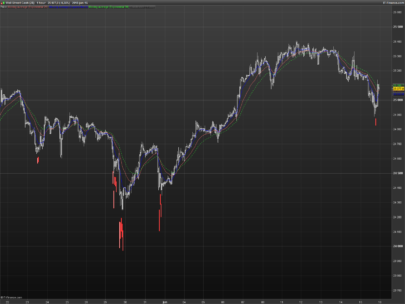
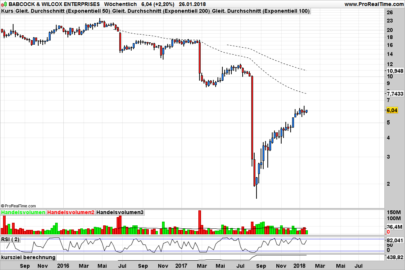
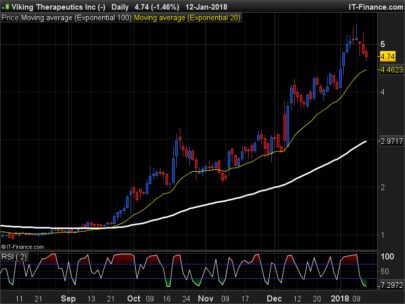
This Code sould find very strong oversold Stock on Daily oder Weekly Chart. I Prefer Weekly.
Its from Elders Book.
|
1 2 3 4 5 6 7 |
c1 = (close-lowest[200](low)[1])/(highest[200](high)[1] - lowest[200](low)[1])*100 c2 = c1 < 10 c3 = Average[52](volume*close) > 3000000 c4 = close*volume > Average[52](volume*close) c5 = high > highest[10](high)[1] SCREENER [c2 and c3 and c4 and c5 ] (close as "Fallen Angel") |
Share this
No information on this site is investment advice or a solicitation to buy or sell any financial instrument. Past performance is not indicative of future results. Trading may expose you to risk of loss greater than your deposits and is only suitable for experienced investors who have sufficient financial means to bear such risk.
ProRealTime ITF files and other attachments :PRC is also on YouTube, subscribe to our channel for exclusive content and tutorials

hi there, i get an error which says the screener does not contain code? Please help me adjust it
I just tried with the itf file from the above post and it contains code. Did you import it into your platform or copy/paste the code into a new screener?