Hi all,
A little screener that can be very useful for swing traders with stocks. I essentially trade stocks with this kind of screener. This one helped me a lot at my beginnings. Sometimes, on 10 stocks, you can have an “explosive” one, which can increase your money fast (fast means that if you take 0,5% risk per trade, you can sometimes get a winning trade with +2% or 3%…)
It can detect stocks that can start increasing fast, with the following criteria :
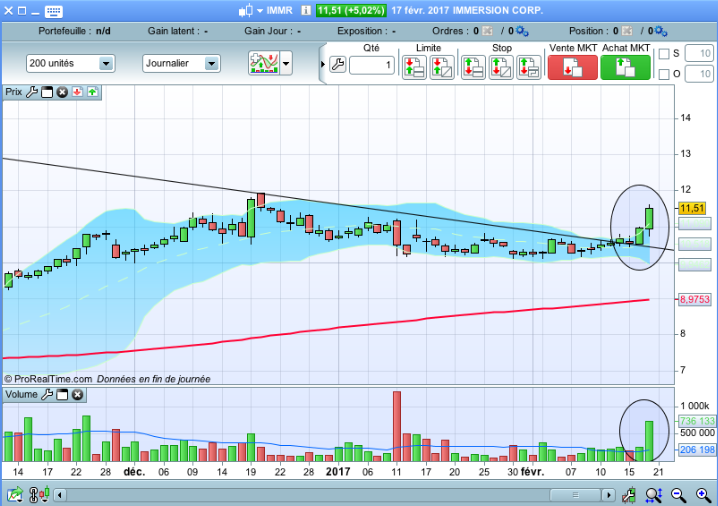
- high volume > 10000 and volume > 2,5 times the average volume of the last 20 periods
- bullish candle
- close > moving average 150 and moving average 150 increasing
- amplitude > 5 times the average amplitude of the 20 last candles
- close > Bollinger and Bollinger increasing in volatility (there was a range before)
On the screenshot, all criterias are here.
In order to take position, don’t forget to draw manually a resistance trend line, that the close must break.
I also always use a stop loss with 0,5% to 1% capital (last swing low, low of the previous range)
|
1 2 3 4 5 6 7 8 9 10 11 12 13 14 15 16 |
// ACTIONS EXPLOSIVES V2 c1 = volume > 2.5* average[20](volume) and volume > 10000 c2 = close > open c3 = close > average[150](close) and average[150](close) > average[150](close[1]) amplitude = close-open c4 = amplitude > 5*average[20](amplitude) c5 = close > bollingerup[20](close) c6 = average[15](bollingerbandwidth[20](close[1])) < 0.8*average[50](bollingerbandwidth[20](close[1])) IF c1 and c2 and c3 and c4 and c5 and c6 THEN ACHAT = 1 ELSE ACHAT = 0 ENDIF screener[ACHAT] |
Share this
No information on this site is investment advice or a solicitation to buy or sell any financial instrument. Past performance is not indicative of future results. Trading may expose you to risk of loss greater than your deposits and is only suitable for experienced investors who have sufficient financial means to bear such risk.
ProRealTime ITF files and other attachments :PRC is also on YouTube, subscribe to our channel for exclusive content and tutorials


Hi, this is amazing! Thanks!
Question, I’m on end of day data. How do you actually implement the results from this? I’m leaning toward more of a swing trader than day trader. Is this something that gives you what can potentially be the start of a multi-period trend up? Or is it meant for a day trader to find what is happening and try to ride it during that day?
btw, could you explain the bollinger part? Are you looking for stocks that are so explosive they potentially break out of the bollinger bands? I don’t know much about them but thought when they hit the top/bottom this was a possible reversal indicator.
Thanks heaps!
Bonjour,
Le n’arrive pas à faire marcher ce screener.
Je télécharge le screener puis l’importante dans PRT et choisis un marché actions.
Au lancement, il ne détecte rien.
Ai-je oublié un paramétrage ?
Merci d’avance du retour
…j’ai le me problème en procédant à un copier-coller du code..
Pareil ne marche pas dommage
Bonjour, quand j’ajoute le code ou le fichier dans l’outils screeners de Prorealtime je ne vois aucun résultat? qui a pu résoudre le problème ? merci.
Bonjour
le code marche bien c est juste qu’il n y a pas d opportunité au moment ou vous le lancez
au 07-10-2020 sur le marché us (nasdaq) j ai 11 lignes et sur le PEA 1 seul ligne