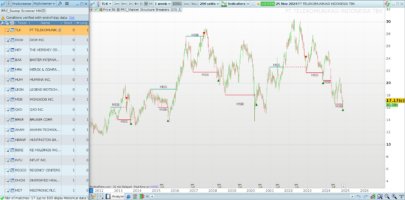
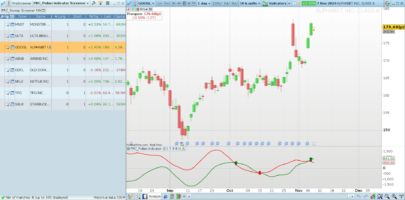
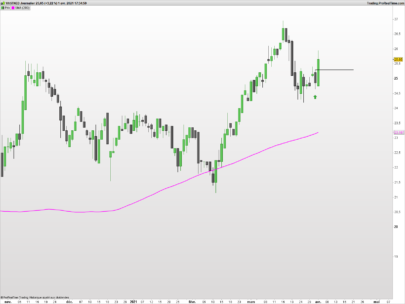
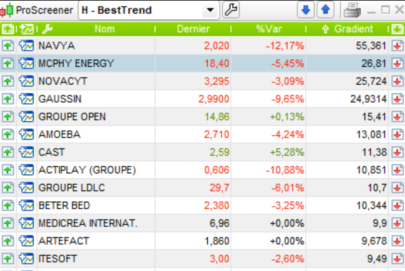
This is a stock screener that spot the consolidation of price in a narrow box over the last 5 weeks. Price range of the last 5 candlestick must be inferior of a 15% consolidation pullback.
Stop limit order maybe place at top of the box on a daily timeframe.
|
1 2 3 4 5 6 7 8 9 |
TIMEFRAME(weekly) fast = average[10](close) slow = average[40](close) spread = ((fast/slow)-1)*100 flatrange = ABS((lowest[5](low)-highest[5](high))/close)*100 c1 = fast>slow AND spread>10 AND close>fast AND flatrange<=15 SCREENER[c1] |
Share this
No information on this site is investment advice or a solicitation to buy or sell any financial instrument. Past performance is not indicative of future results. Trading may expose you to risk of loss greater than your deposits and is only suitable for experienced investors who have sufficient financial means to bear such risk.
ProRealTime ITF files and other attachments :PRC is also on YouTube, subscribe to our channel for exclusive content and tutorials




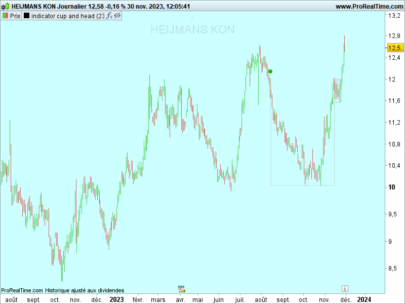
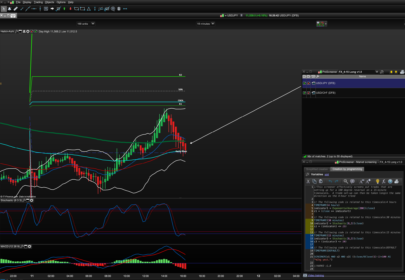
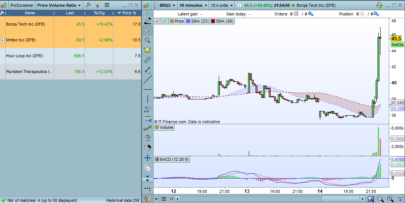
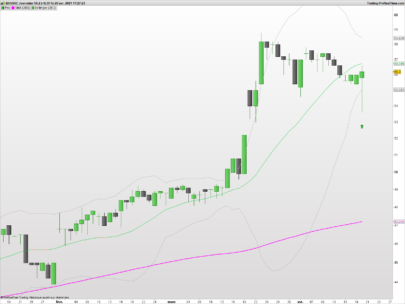
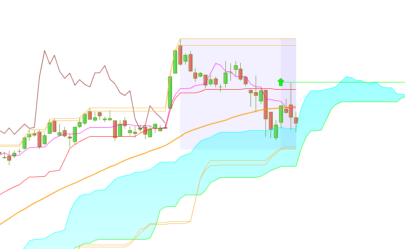
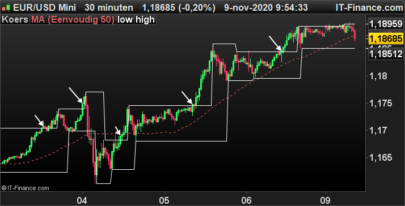
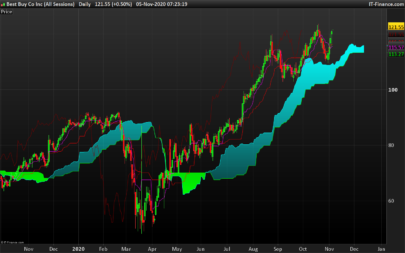
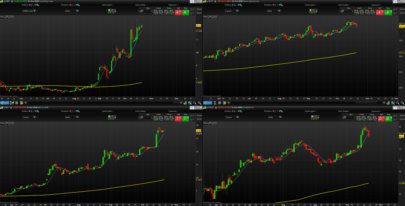
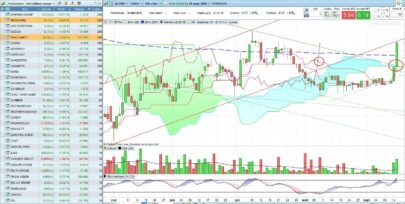
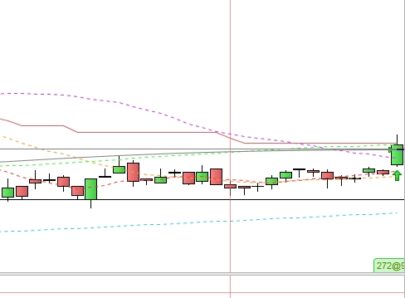
Est-il envisageable de créer une box de consolidation sur x bougies utilisable sur des timeframe intraday (M5, M15) voir des tickcharts (bougies en 70 ticks)… une box tracée sur le chart pour la V3 par exemple
Oui c’est très faisable, ouvre un topic stp dans le support probuilder francophone et on le fera ensemble là bas.
I would like to ask you what does spread mean? Thank you
In this case Spread is the difference in percentage between the 2 moving average
Thank you! Very kind
Is it possible to change the range and have it between 2 weeks and 8 weeks?