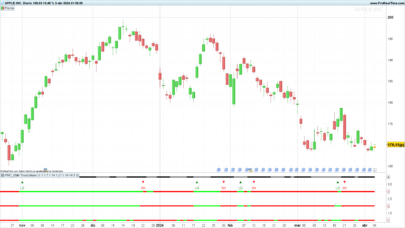
This indicator is based heavily on Nicolas’ work on Bullish and Bearish Heiken Ashi screener and should only be considered an add-on.
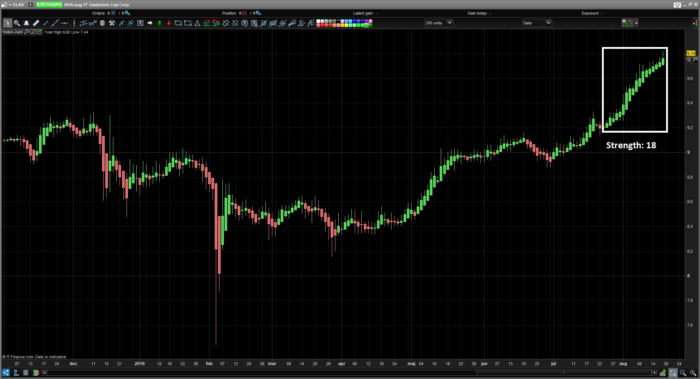
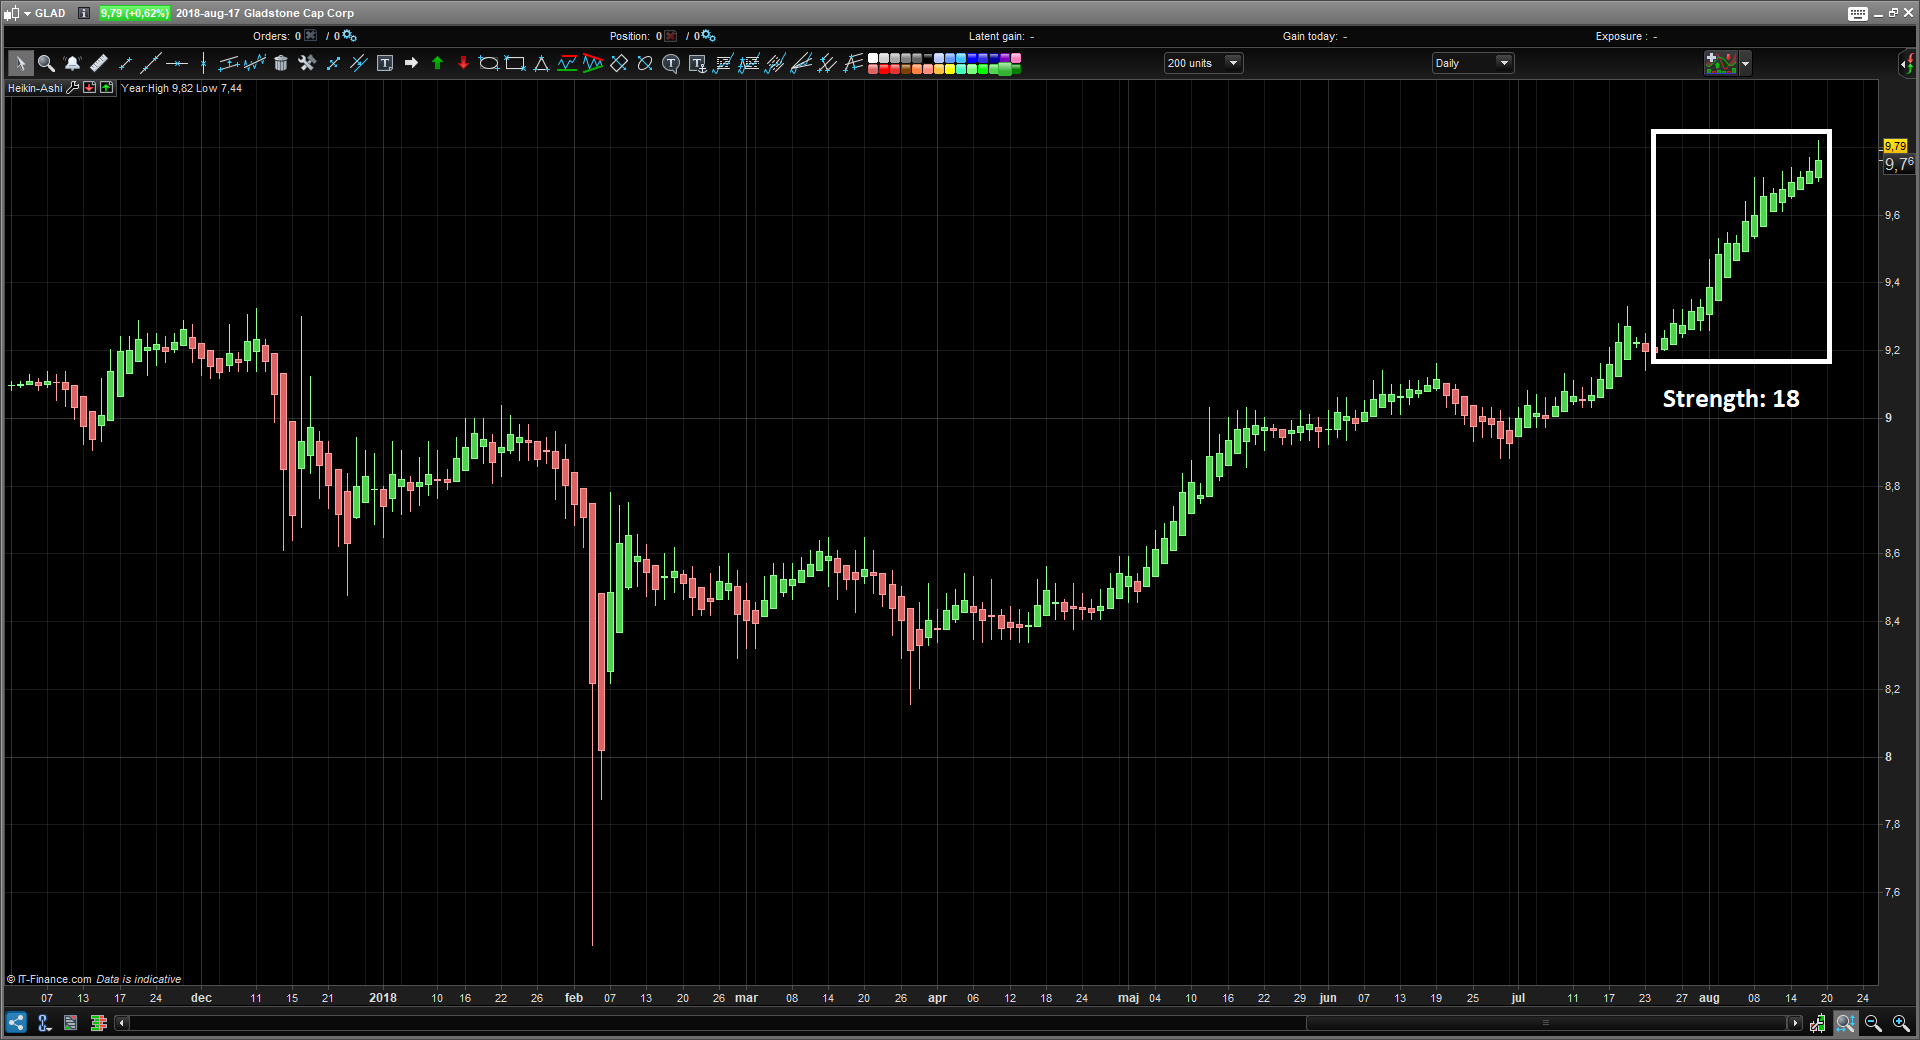
I sometimes use this Heikin Ashi Trend screener to find trending assets for possible trend continuation trades. The indicator counts how many green/red candles the asset has accrued in the current cycle. You can add bull-trending assets (high value positive Strength criteria) and bear-trending (low value negative Strength criteria) to a watchlist. You then watch these assets for pullbacks to find trend continuation trades, using like Nicolas’ Bullish and Bearish Heiken Ashi screener above.
|
1 2 3 4 5 6 7 8 9 10 11 12 13 14 15 16 17 18 19 20 21 22 23 24 25 26 |
ONCE Bull = 0 ONCE Bear = 0 ONCE xOpen = 0 xClose = (Open+High+Low+Close)/4 if(barindex>2) then xOpen = (xOpen[1] + xClose[1])/2 endif c1 = xClose>xOpen c2 = xClose<xOpen IF c1 THEN Bear = 0 Bull = Bull + 1 ELSIF c2 THEN Bull = 0 Bear = Bear - 1 ELSE // IF xClose and xOpen are exactly the same value Bull = 0 Bear = 0 ENDIF Grade = Bull + Bear SCREENER[c1 OR c2](Grade AS "Strength") |
Share this
No information on this site is investment advice or a solicitation to buy or sell any financial instrument. Past performance is not indicative of future results. Trading may expose you to risk of loss greater than your deposits and is only suitable for experienced investors who have sufficient financial means to bear such risk.
ProRealTime ITF files and other attachments :PRC is also on YouTube, subscribe to our channel for exclusive content and tutorials
