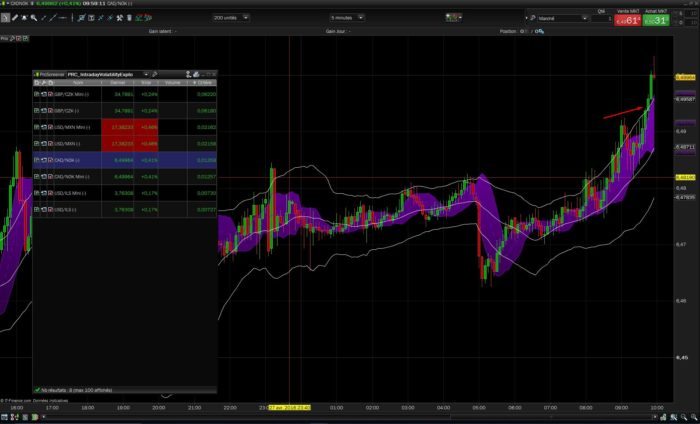
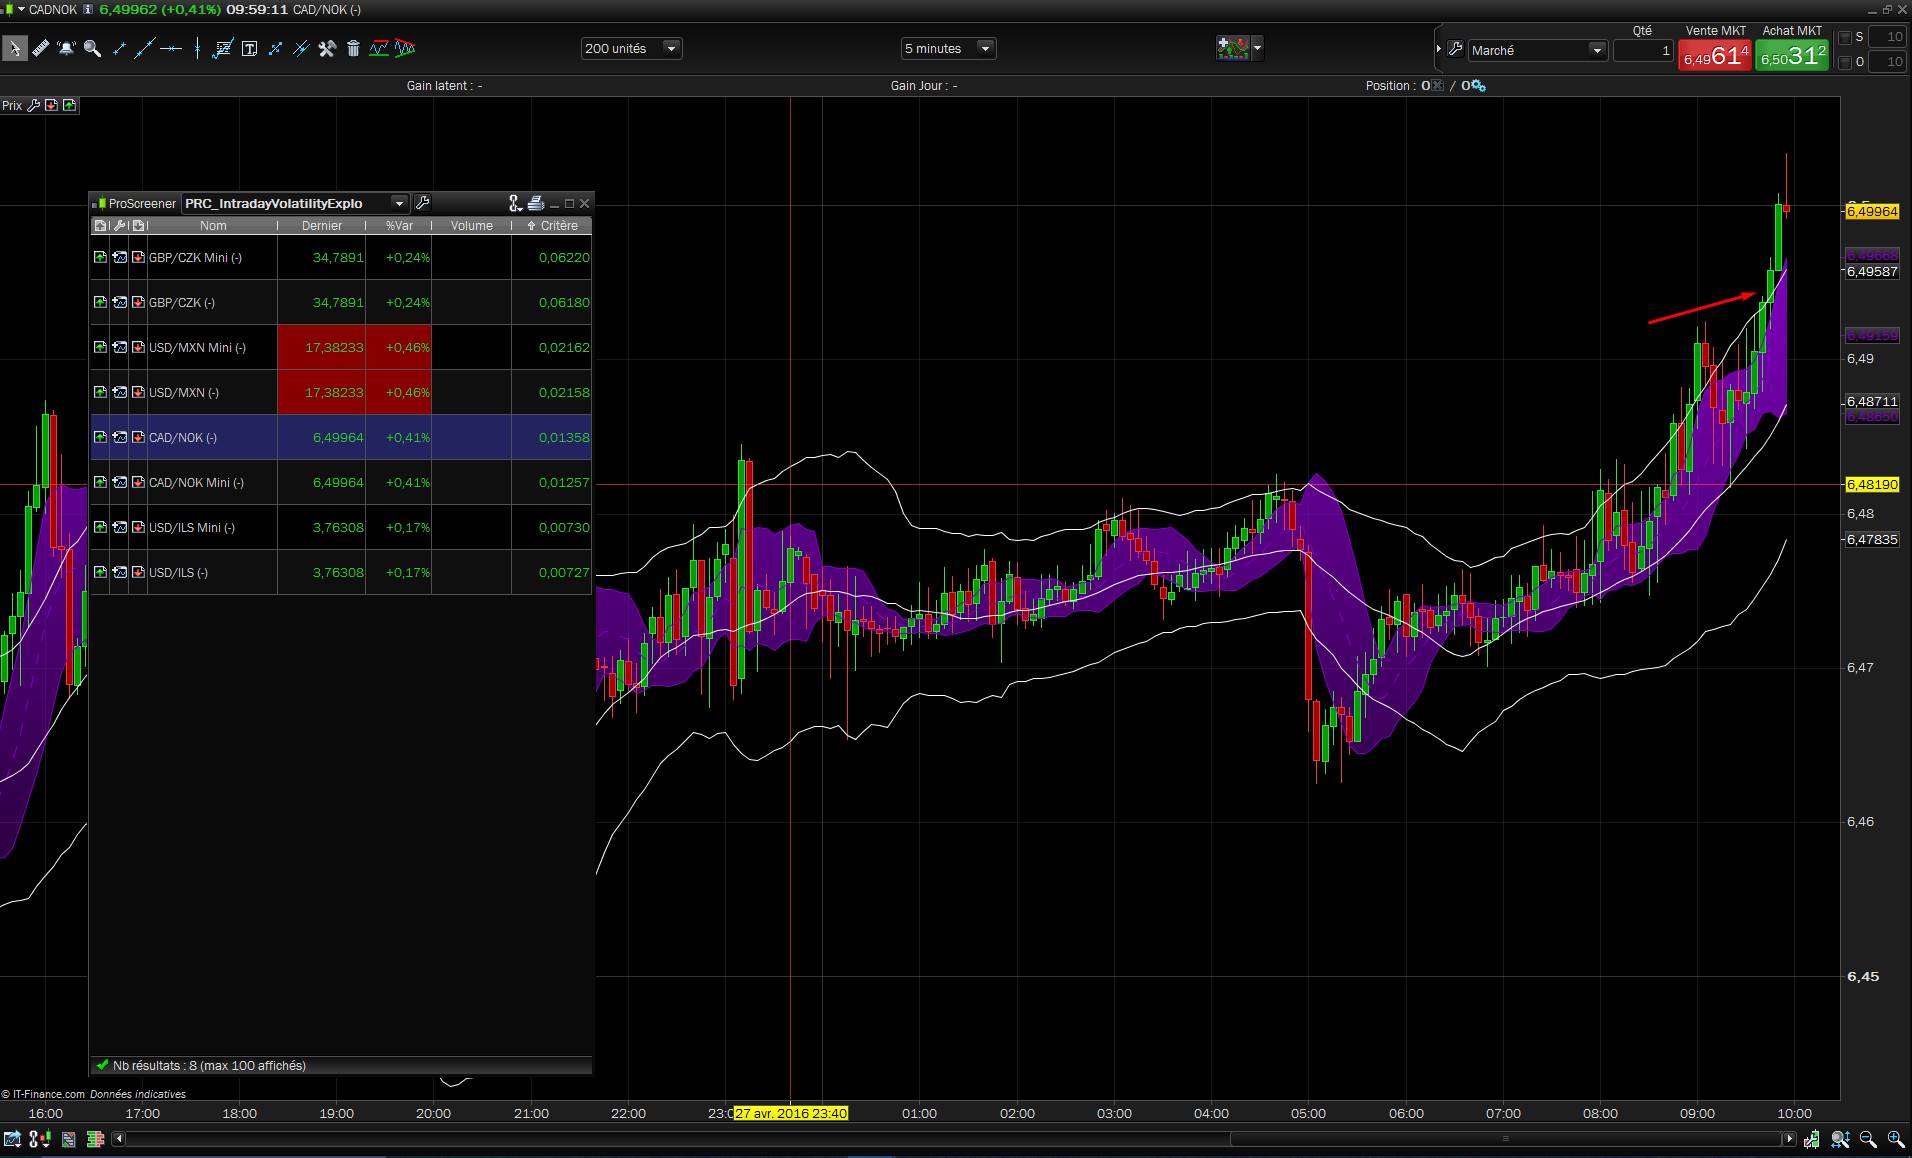
This screener is an attempt to find price volatility explosion in intraday. The code spots if the last activity of the Bollinger bands were quiet before it breaks up or down a keltner channel made of typical price moving average.
The default parameters work well for forex on a 5 minutes timeframe.
You can try and explore the parameters for any instrument and timeframe horizons. If you find better parameters or ideas to complete this code, I would be glad to improve it.
|
1 2 3 4 5 6 7 8 9 10 11 12 13 14 15 16 17 18 19 20 21 22 23 24 25 26 27 28 29 30 31 32 33 34 35 36 |
//********* Parameters ********* //Keltner channel n=20 coeff=1.5 //Bollinger Bands period=10 deviation=1 //Candles lookback xCandles=4 //****************************** //keltner bands MA = Average[N](TypicalPrice) UpperBand = MA + coeff*Average[N](Range) LowerBand = MA - coeff*Average[N](Range) //bollinger bands BBmiddle = average[period](close) dev = std[period](close) BBup = BBmiddle+dev*deviation BBdown = BBmiddle-dev*deviation count = 0 for i = 1 to xCandles do c1 = BBup[i]<UpperBand[i] c2 = BBdown[i]>LowerBand[i] if c1 and c2 then count = count+1 endif next validate = count=xCandles bullishexplosion = BBup>UpperBand bearishexplosion = BBdown<LowerBand SCREENER [validate AND (bullishexplosion OR bearishexplosion)] (close-MA) |
Share this
No information on this site is investment advice or a solicitation to buy or sell any financial instrument. Past performance is not indicative of future results. Trading may expose you to risk of loss greater than your deposits and is only suitable for experienced investors who have sufficient financial means to bear such risk.
ProRealTime ITF files and other attachments :
Find other exclusive trading pro-tools on ![]()
PRC is also on YouTube, subscribe to our channel for exclusive content and tutorials


Hallo Nicolas,
I think this is a great Idea.
I tried a screener “Hammer breakout within 4 bars after the occure of a hammer”
So the screener should deliver all shares with a hammer and with a close over the high of the hammer with the first, the second, the third or at least with the fourth bar.
I tried various hours, but I couldnt get a perfect working screener. Could you help me?
Best regards
Michael
// Hammer up
Hup = close[i]>high[i+1]
Hdown = close[i]open(i+1) and high(i+1)=close(i+1) and (open(i+1)-low(i+1))>=2.5*(close-open)
//Candles lookback
xCandles=4
//******************************
TIMEFRAME (daily)
countd = 0
for i = 1 to xCandles do
b1 = (Hup=0)
b2 = (Hdown=0)
if Hammer and b1 and b2 then
countd = countd+1
endif
next
c1=Hammer and Hup and countd<=xCandles
Hello, First time to post. What are “Criteria” in your scanner? What is its metric?