This screener will find swing setup with these criteria:
- market is in an up/bullish trend since 50 periods (MA50>MA200 since 50 periods)
- recent trend slope is ascending (MA20A superior to its previous value)
- new lower low detected in the last “lookback” period
A rebound of the trend should occur at that time, should be more accurate in daily and weekly timeframes.
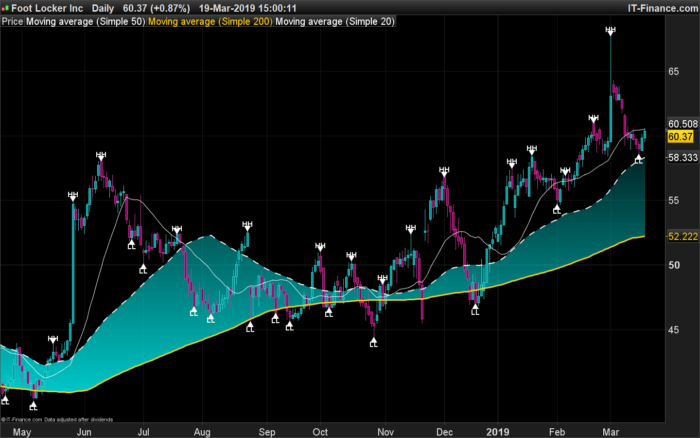
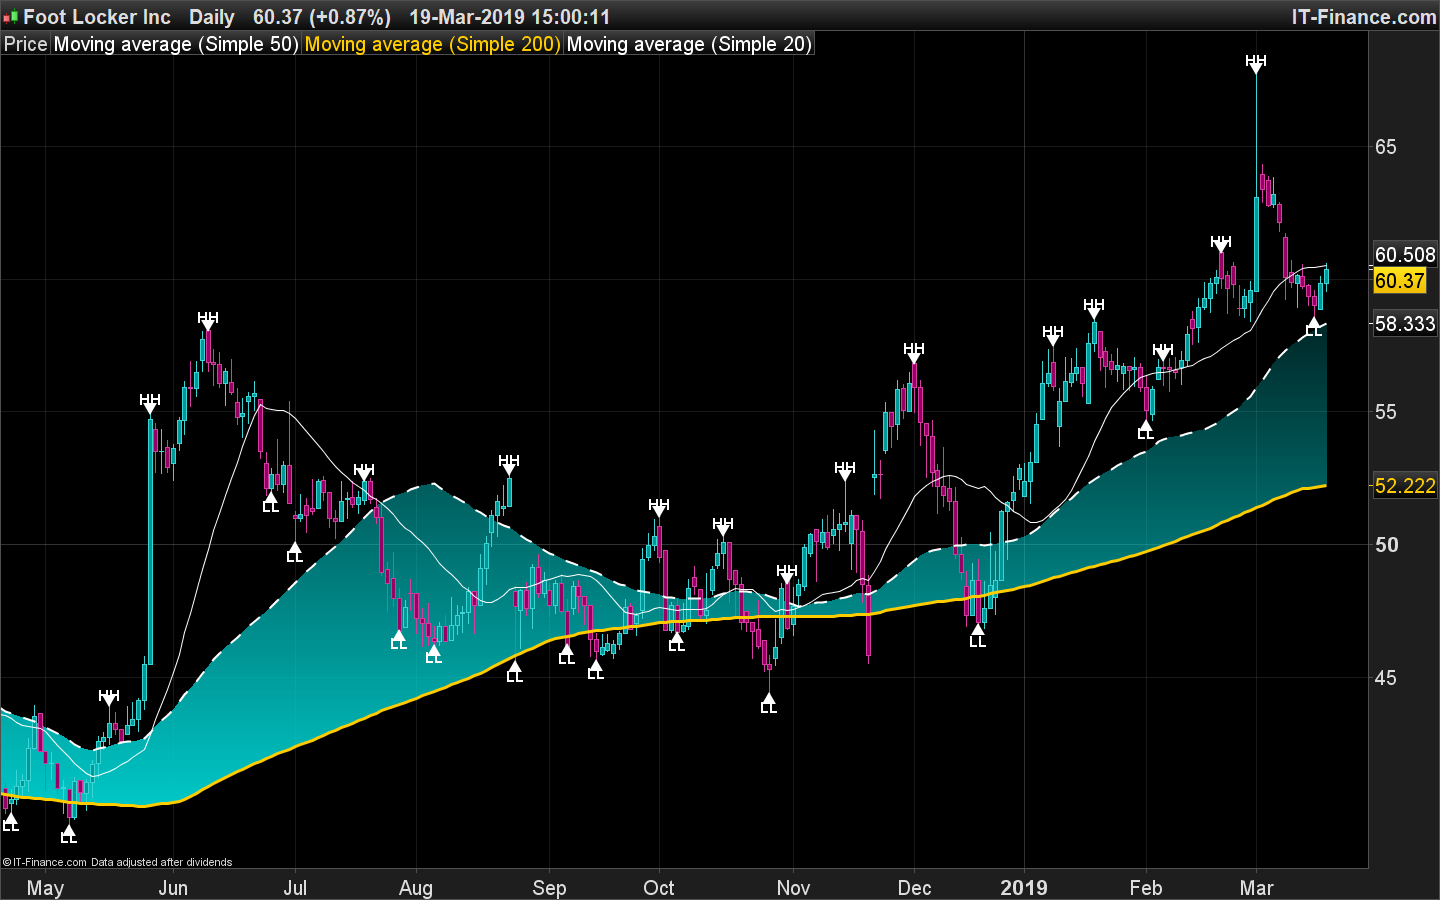
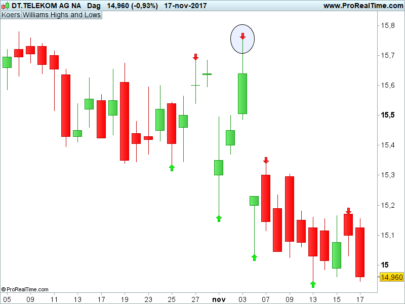
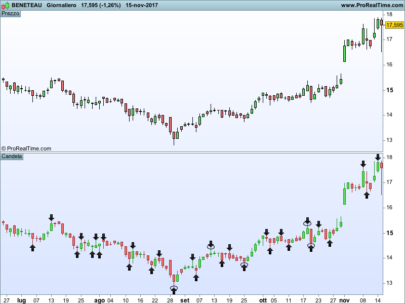
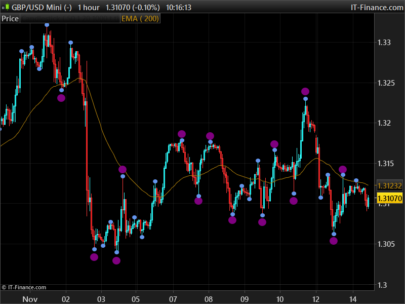
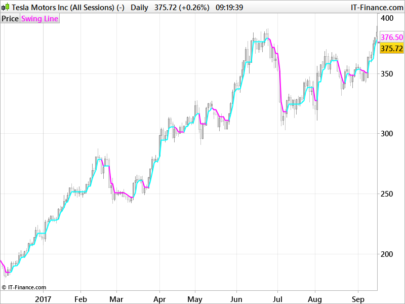
Higher highs and lower lows indicator (similar to the one of the featured image) can be found in this topic: Higher Highs and Lower Lows indicator and screener
|
1 2 3 4 5 6 7 8 9 10 11 12 13 14 15 16 17 18 19 20 21 22 |
//PRC_LowerLows up Swing | screener //19.03.2019 //Nicolas @ www.prorealcode.com //Sharing ProRealTime knowledge // --- settings lookback = 2 // --- end of settings botf = low[4] > low[2] and low[3] >= low[2] and low[2] <= low[1] and low[2] < low[0] if botf then lowerlow=low[2] endif ma20=average[20] ma50=average[50] ma200=average[200] up=summation[50](ma50>ma200)=50 and ma20>ma50 and ma20>ma20[1] scan = summation[lookback] (lowerlow<lowerlow[1] and up)>0 screener[scan] |
Share this
No information on this site is investment advice or a solicitation to buy or sell any financial instrument. Past performance is not indicative of future results. Trading may expose you to risk of loss greater than your deposits and is only suitable for experienced investors who have sufficient financial means to bear such risk.
ProRealTime ITF files and other attachments :PRC is also on YouTube, subscribe to our channel for exclusive content and tutorials


Bonjour Nicolas,
Bravo pour cet indicateur ! Je l’ai mis en place sur mes graphs. Un grand merci car il me sert énormément.
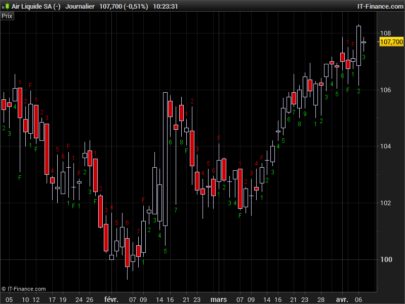
En revanche, j’aimerai mettre de alertes sonores sur Mes UT daily et 4 heures lorsque la flèches du plus haut apparait mais je n’y parviens pas.
Auriez-vous une petite idée ? Merci beaucoup 🙂
Merci d’ouvrir un sujet dans le forum des indicateurs ProBuilder, car ça concerne l’indicateur dont le lien se trouve dans la description. J’y répondrai dés que possible.
Bonjour Nicolas,
Je contrôlais justement la réponse à mon post durant qq jours mais sans réponse. Et par hasard, je vois la réponse à ma demande.
Je vous remercie beaucoup Nicolas, je vais le télécharger immédiatement.
Un grand merci pour toutes vos contributions professionnelles et réactivité.
Très belle journée à vous 🙂
Sophie
Bonjour Nicolas,
Je reviens sur votre indicateur qui fonctionne à merveille sur les graphs.
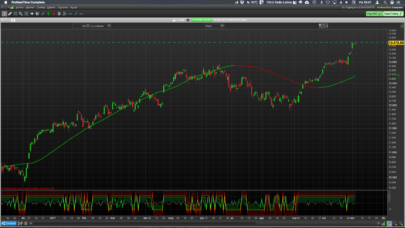
En revanche, je souhaiterai insérer cet indicateur également en tant qu’indicateur indépendant sous le graph donc j’ai choisis et insérer ce même indicateur mais visiblement cela ne fonctionne pas.
Savez-vous ce qu’il faut modifier dans le code afin de l’ajouter sous le graph et non sur le graph?
Merci beaucoup.
Parce que l’échelle ne s’adapte pas automatique, on peut modifier la dernière ligne par :
RETURN CLOSE
Merci beaucoup Nicolas,
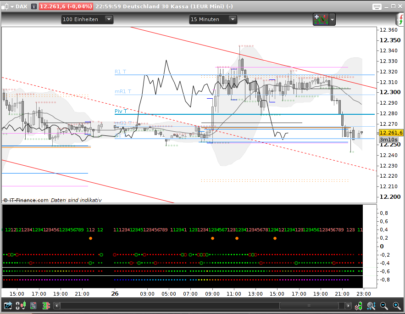
En effet l’ajout du close affiche le même graph, je parlais d’afficher cet indicateur indépendant avec des barres (style histogramme), valeur = 1 et valeur = 2 au moment de l’affichage des petits triangles visibles sur le graph.
Est-ce possible?
Non tu ne parlais pas de cela ?! Il fallait afficher l’indicateur sous le graphe principal et j’ai correctement répondu 🙂
Merci d’ouvrir un sujet pour cette demande de modification dans le forum des indicateurs.
Ok Nicolas je vais le poster.
Je me suis mal exprimée alors. Je refais un post.
Merci
Belle journée