Modified Sharpe index screener

Modified Sharpe index screener

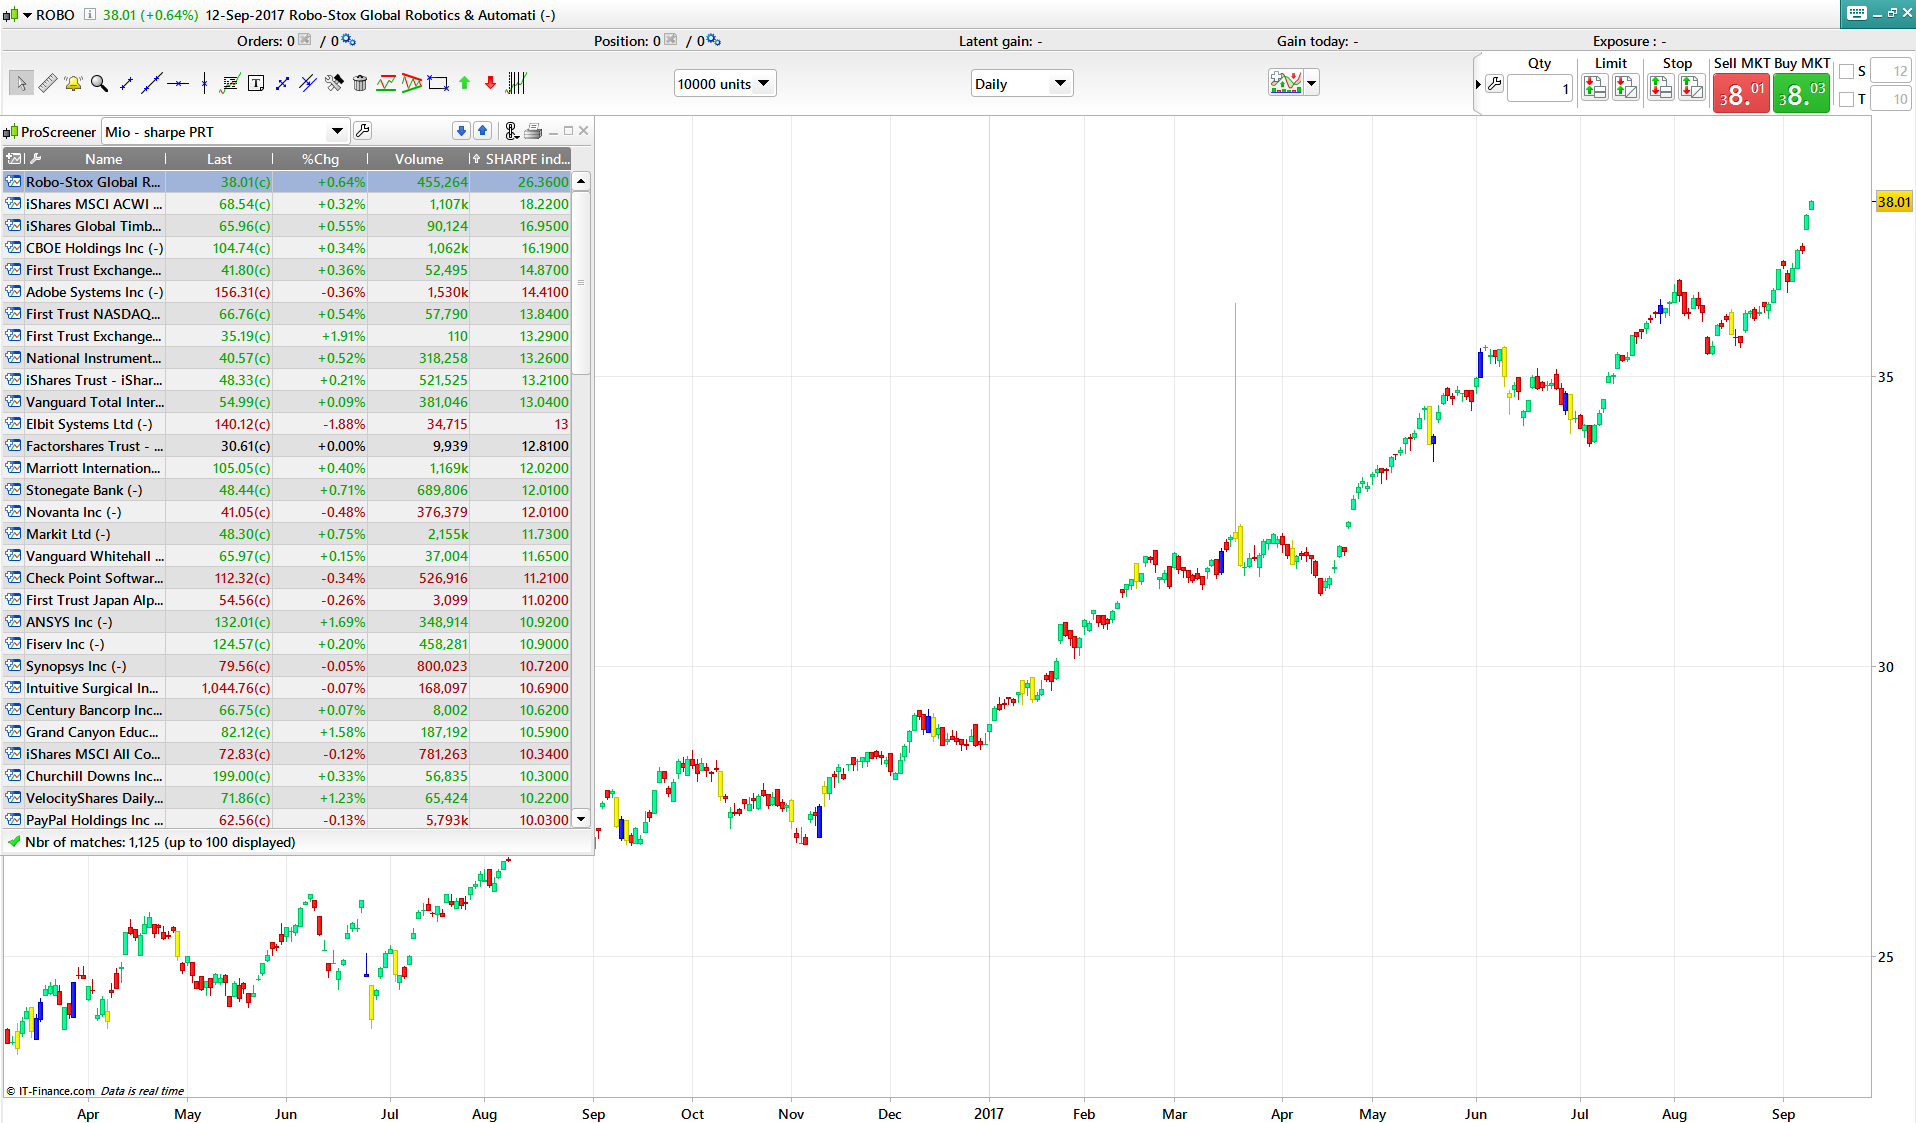
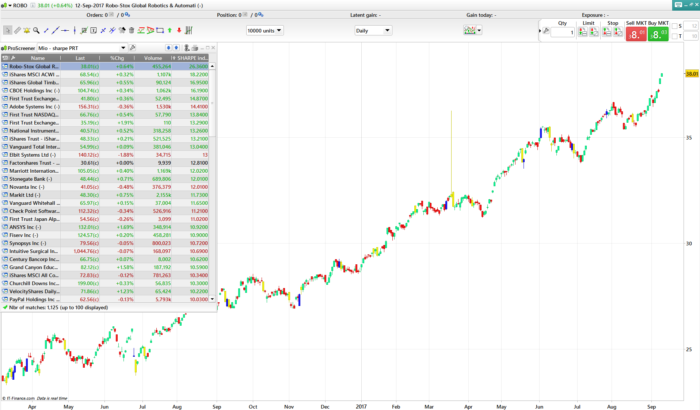
This screener uses a modified Sharpe index to identify stocks with a strong momentum. The rules are as follows:

1. screen the markets and select the strongest 20-30 stocks (the first stocks on the screener are the strongest)
2. buy those stocks position-sizing them based on the Yhang-Zhan variation of Garman-Klass volatility (indicator I posted previously) :
3. after 3 months run the same procedure and get rid of the stocks that are out of the first tier of the list and get the new entries

OR

3. hold the stocks for 1 year and then sell.

I’ve been using this portfolio for 6 years now and the average gain of the folio was excellent for me. You can improve the profit by buying at the SMA60 point.

Blue skies!!

Share this

Risk disclosure:

No information on this site is investment advice or a solicitation to buy or sell any financial instrument. Past performance is not indicative of future results. Trading may expose you to risk of loss greater than your deposits and is only suitable for experienced investors who have sufficient financial means to bear such risk.

ProRealTime ITF files and other attachments : How to import ITF files into ProRealTime platform?

PRC is also on YouTube, subscribe to our channel for exclusive content and tutorials
  1. Nicolas • 09/13/2017 #

    What a nice addition to our library gabri! Thanks a lot, should help a lot of people.

  2. juanj • 09/13/2017 #

    @Gabri, what average yearly return % have you been able to manage using this approach?

    • gabri • 09/13/2017 #

      juanj,
      I used this system for the last 13 years approximately and I got a Compound annual growth rate (CAGR) of approximately 23%. Using also some fundamentals you can get more though.

  3. juanj • 09/13/2017 #

    @Gabri with an ROI track record like that you should be a fund manager 🙂

    • gabri • 09/13/2017 #

      juanj,
      I just read back my post….I made cagr of approx 13% in the last 13 years… sorry 🙂 now I understand why you mentioned the fund manager 🙂 sorry.

  4. gabri • 09/13/2017 #

    I would need way more than that for being a found manager 🙂

  5. haseluis • 09/13/2017 #

    Hello, who can help me why the screener does not work
    // Der folgende Code bezieht sich auf den Zeitraum:daily
    TIMEFRAME(daily)
    indicator1 = SuperTrend[2.5,10]
    c1 = (close > indicator1)

    // Der folgende Code bezieht sich auf den Zeitraum:1 hour
    TIMEFRAME(1 hour)
    indicator2 = SuperTrend[2.5,10]
    c2 = (close > indicator2)

    // Der folgende Code bezieht sich auf den Zeitraum:15 minutes
    TIMEFRAME(15 minutes)
    indicator3 = SuperTrend[2.5,10]
    c3 = (close > indicator3)

    SCREENER[c1 AND c2 AND c3]

  6. gabri • 09/13/2017 #

    It works when I launch it. Try to change the last row as follow:
    SCREENER[c1 AND c2 AND c3] ( c3 as “ref”)

  7. Alex975 • 09/13/2017 #

    Complimenti Gabri era da un po’ che volevo provare a far un screener ed una metodologia come descrivi tu per periodi più lunghi ed holdare i titoli.. pensavo più su un paniere di etfs.
    Thanks Garbri, I was thinking about this kind selection methodology for some time. Ale

  8. gabri • 09/13/2017 #

    Grazie,
    con ETF to consiglio anche uno screener basato su questa strategia https://www.prorealcode.com/prorealtime-trading-strategies/price-index-6-months/ . Il price index a 6 mesi e
    molto efficace, secondo me, con ETF.

  9. Alex975 • 09/13/2017 #

    Grazie della dritta.. testerò il tutto.

  10. guillermus69 • 09/13/2017 #

    is this ” a= log(close/close[1])” better than a = ((close/close[1]) -1) *100 . I want to capture the daily returns in % ?¿?¿?¿?¿?

  11. gildaslm • 09/13/2017 #

    Hi gabri, thanks very much for your work, it helps me a lot. Have you ever tried to make the same thing with the sortino ratio ?

  12. gandolfi • 09/13/2017 #

    thanks for your screener. Do you have the code for original Sharp ratio in order to compare ? Do you have the same thing for Sortino ratio ?

avatar
Register or

Likes

avatar avatar avatar avatar avatar avatar avatar avatar avatar avatar avatar avatar avatar avatar avatar avatar
Related users ' posts
Jean2139 Bonjour Yvan, Merci pour ton indicateur que je trouve très intéressant. Je suppose que tu ...
Suffi Hier eine kleine Korrektur: //-----Inputs-----------------------------------------// MALengt...
kats BONSOIR c bon merci j ai trouve ce weekend merci de votre reponse cdlt
the_giorgio Hi, nice work I would like to understand something about prorealtime code. With your ...
Iván Hello. When you use the drawcandle() instruction then in the configuration window you add ...
Gio56 Super idée. j'ai juste un souci. j'ai pas de barre verte mais plusieurs lignes de couleurs.....
DeathMetal change line in histgram, (click on indicator name, click on tool (
Gio56 Super merci.
jacquesgermain sì da aggiungere
Maik2404 auf welchen Wert muss ich die Kompresionsperiode stellen?
jacquesgermain — Période de compression : ce paramètre détermine la période de rétrospection utilisée pour ...
Gianluca Amazing, thank You for your contribution!
Alex Spioglou Thank you for featuring my work, and I hope you found it useful. Mind the paper was publ...
AndPar Buongiorno Nicolas, vorrei provare questo indicatore, ma quando lo inserisco in PRT mi vengo...
Nicolas Basta aggiungerlo al prezzo https://www.prorealcode.com/blog/video-tutorials/how-to-add-an-i...
Aragorna hello Nicolas, this indicator works with the last Beta version of PRT? Ive seen tha many in...
SnorreDK Works extremely well - How? How do u implement this in a startegy? Breakoutstrategy?
Keyeming Thanks, but yes same question as above, some explanations on how to read it would be appreci...
Bateson Bonjour. Merci beaucoup ! J'ai installé l'indicateur sur PRT 11 mais pour des raisons qui ...
CederTrader Hi Denis, does this indicator add to the chart as panel, or on the candles. Thanks
Nicolas Add it on the price chart as described in this video: https://www.prorealcode.com/blog/video...
Denis Hello Nicolas and Ceder Trader, Sorry, I only just saw your replies. The indicator is alre...
Seabiscuit Hi! I like this indicator a lot, been using it on a 30 min timeframe and usually confirms my...
Ramahu Bonjour et merci pour cet indicateur ! je l'observe sur les actions du Nasdaq et la plupart ...
Nicolas Il doit s'agir d'un mauvais copier/coller. Je suggère de télécharger le fichier itf contenu ...
Bard Hello @Nicolas, I can get this to display in a separate indicator panel but not on Price as ...
Stenozar Hi @Nicolas, how can I put the bands on price? Thanks, Stefano
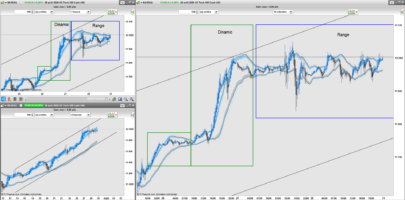
Fabian Hi IV Mcm, have you drawn the rectangles (Dinamic, Range) by yourself in the chart or are...
IV Mcm Myself to illustrate ;)
oraclus Bonjour indicateur très intéressant existe t il un screener qui détecte les actions qui donn...
IV Mcm Ce n'est pas le but de cet indicateur, mais avec un peu d'entraînement vous pourriez le code...
Yantra Thank you for sharing your good work!
Madrosat I Have not see a fully functioning automated strategy on your site?? Really have you???
juanj Hi Madrosat, why would it be on my site? I have developed it for my personal use and also to...
Madrosat ok I understood you are using prorealcode to hack the fish
jaginho Bonjour Vivien, je n'arrive pas à comprendre ce screener... En tout cas merci pour tes contr...
avatar
Anonymous Superb, merci!
luxrun sorry, add prt code add doesn't work
robertogozzi Don't worry about PRT code, I can't make it work either! Great for pointing that out, it's ...
Khaled @Luxrun, good morning, you mentionned "y = exponentialaverage (x)", isn't the period of the ...
luxrun One question, Roberto: the two AvgT are variable, could you explain to me what they regulate...
robertogozzi AvgT stands for Average Type, it's a parameter for the AVERAGE keyword (https://www.prorealc...

Top