Modified Sharpe index screener

Modified Sharpe index screener

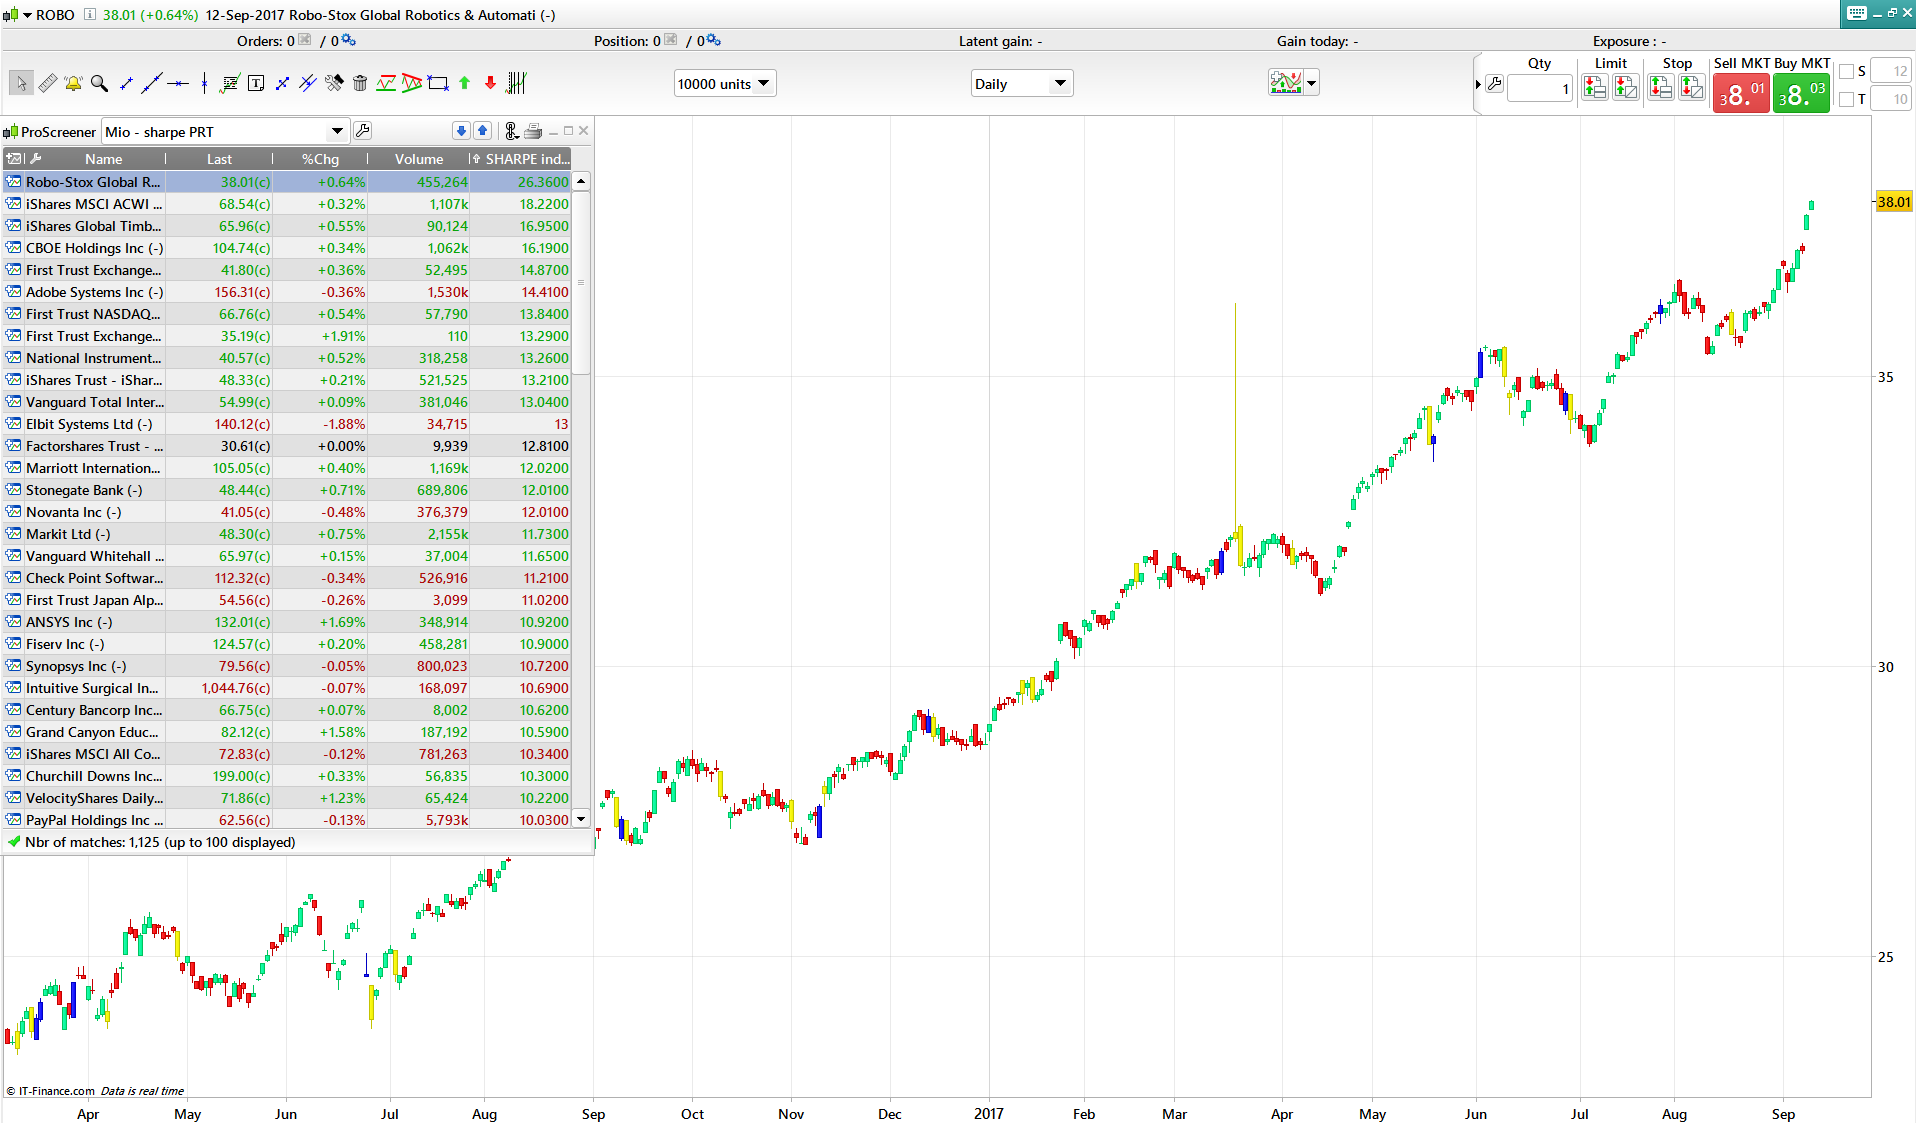
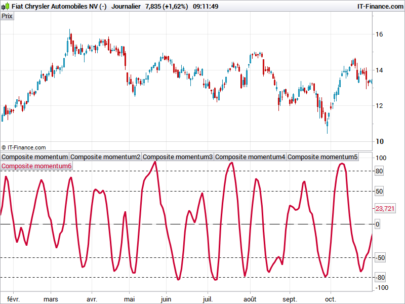
This screener uses a modified Sharpe index to identify stocks with a strong momentum. The rules are as follows:

1. screen the markets and select the strongest 20-30 stocks (the first stocks on the screener are the strongest)
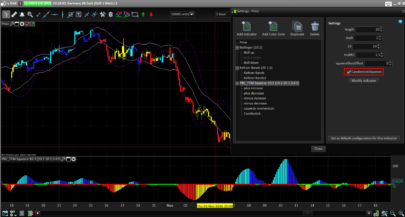
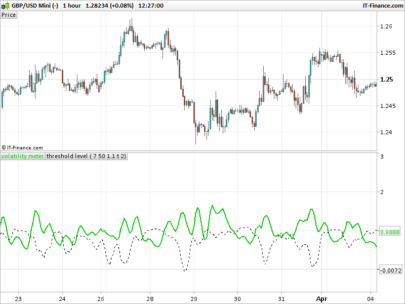
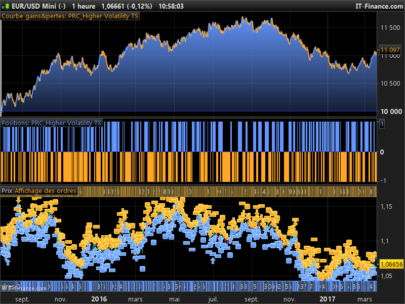
2. buy those stocks position-sizing them based on the Yhang-Zhan variation of Garman-Klass volatility (indicator I posted previously) :
3. after 3 months run the same procedure and get rid of the stocks that are out of the first tier of the list and get the new entries

OR

3. hold the stocks for 1 year and then sell.

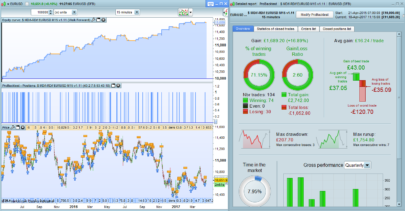
I’ve been using this portfolio for 6 years now and the average gain of the folio was excellent for me. You can improve the profit by buying at the SMA60 point.

Blue skies!!

Share this

Risk disclosure:

No information on this site is investment advice or a solicitation to buy or sell any financial instrument. Past performance is not indicative of future results. Trading may expose you to risk of loss greater than your deposits and is only suitable for experienced investors who have sufficient financial means to bear such risk.

ProRealTime ITF files and other attachments : How to import ITF files into ProRealTime platform?

PRC is also on YouTube, subscribe to our channel for exclusive content and tutorials

  1. Nicolas • 09/13/2017 #

    What a nice addition to our library gabri! Thanks a lot, should help a lot of people.

  2. juanj • 09/13/2017 #

    @Gabri, what average yearly return % have you been able to manage using this approach?

    • gabri • 09/13/2017 #

      juanj,
      I used this system for the last 13 years approximately and I got a Compound annual growth rate (CAGR) of approximately 23%. Using also some fundamentals you can get more though.

  3. juanj • 09/13/2017 #

    @Gabri with an ROI track record like that you should be a fund manager 🙂

    • gabri • 09/13/2017 #

      juanj,
      I just read back my post….I made cagr of approx 13% in the last 13 years… sorry 🙂 now I understand why you mentioned the fund manager 🙂 sorry.

  4. gabri • 09/13/2017 #

    I would need way more than that for being a found manager 🙂

  5. haseluis • 09/13/2017 #

    Hello, who can help me why the screener does not work
    // Der folgende Code bezieht sich auf den Zeitraum:daily
    TIMEFRAME(daily)
    indicator1 = SuperTrend[2.5,10]
    c1 = (close > indicator1)

    // Der folgende Code bezieht sich auf den Zeitraum:1 hour
    TIMEFRAME(1 hour)
    indicator2 = SuperTrend[2.5,10]
    c2 = (close > indicator2)

    // Der folgende Code bezieht sich auf den Zeitraum:15 minutes
    TIMEFRAME(15 minutes)
    indicator3 = SuperTrend[2.5,10]
    c3 = (close > indicator3)

    SCREENER[c1 AND c2 AND c3]

  6. gabri • 09/13/2017 #

    It works when I launch it. Try to change the last row as follow:
    SCREENER[c1 AND c2 AND c3] ( c3 as “ref”)

  7. Alex975 • 09/13/2017 #

    Complimenti Gabri era da un po’ che volevo provare a far un screener ed una metodologia come descrivi tu per periodi più lunghi ed holdare i titoli.. pensavo più su un paniere di etfs.
    Thanks Garbri, I was thinking about this kind selection methodology for some time. Ale

  8. gabri • 09/13/2017 #

    Grazie,
    con ETF to consiglio anche uno screener basato su questa strategia https://www.prorealcode.com/prorealtime-trading-strategies/price-index-6-months/ . Il price index a 6 mesi e
    molto efficace, secondo me, con ETF.

  9. Alex975 • 09/13/2017 #

    Grazie della dritta.. testerò il tutto.

  10. guillermus69 • 09/13/2017 #

    is this ” a= log(close/close[1])” better than a = ((close/close[1]) -1) *100 . I want to capture the daily returns in % ?¿?¿?¿?¿?

  11. gildaslm • 09/13/2017 #

    Hi gabri, thanks very much for your work, it helps me a lot. Have you ever tried to make the same thing with the sortino ratio ?

  12. gandolfi • 09/13/2017 #

    thanks for your screener. Do you have the code for original Sharp ratio in order to compare ? Do you have the same thing for Sortino ratio ?

avatar
Register or

Likes

avatar avatar avatar avatar avatar avatar avatar avatar avatar avatar avatar avatar avatar avatar avatar avatar
Related users ' posts
Francesco78 Hi Pepmartorell, please let's continue the discussion on the forum thread so that we can sha...
Jusmih1 Hi there, i am looking at your Strategy however when you put in automatic trading mode its ...
finplus Thanks for the job. Which variables do you suggest for timeframe 1 hour? 
Maz Depends massively on your market and the volatility. I suggest using the variable optimizer ...
1Randy This a great momentum filter! I would like to see volume momentum incorporated into the indi...
bruces Hi. Thank you that is what I am looking for. As well as the chart, I want to also add to a...
Jodal Bonjour Nicolas, Merci pour cet indicateur! Est-ce possible de configurer une alerte pou...
Nicolas Merci pour le post dans le forum en respectant les règles de publication énoncées dans le ca...
Dron De lo mejorcito
Swingforfortune
8 years ago
gatarayihajp Hi swingforfortune, Thanks a lot about your interesting posting. Let ask you to explain mor...
Swingforfortune Hello. Basically they are a twist of the MACD histogram and can be used as such. They visua...
gatarayihajp Hi again Thanks for the explanation. Have a good day
fabio407 Thanks, Nicolas. Very useful. Would you tell me where to find what result conveys the functi...
Nicolas This is not an instruction of the programming language but a variable from this indicator (l...
fabio407 OK. I didn't notice it. Many thanks, Nicolas!
Nicolas All conditions under parenthesis for the c1 to c4 conditions should be inverted. 
tomus Can you give an example of the overbought codes please? Thanks.
ams123 Frank Merci Nicholas -:)
Wilko And not only readable.... makes it much easier to iterate different entry/exit-conditions, d...
IGOSNELL Hi Interesting strategy, when I used $ M-R Dif EURUSD M15 Long if does not enter any positi...
ilvillans HI, I modified the system, from good results but from this error: Replace the variables wit...
gabri
8 years ago
Marcel Thank you for this one. I played around with this indicator with Bollinger Bands around it i...
Nicolas Restart your platform in order to be sure to use the last version, there was a version rollb...
bertrandpinoy bonjour voud pouvez m envoyer le code modifier par vous?
Nicolas Désolé , je ne comprends pas votre question.
Nicolas Rien, il faut l'appliquer sur la charte. Soit le mettre sur le graphique du prix, à l'aide d...
signorini Merci pour votre réponse. Je l'applique sur la charte, j'utilise la petite clé pour effacer ...
signorini Je vous remercie, Nicolas. C'est fixé. Très bon week-end.
Abz  hi , you need to add the indicator from the "price" menu in chart
Francesco Thank you Abz!
phanz Hi Nicolas, this is an interesting strategy. For long position, I assume entry when prices ...
Nicolas
8 years ago
supertiti bonjour à tous J'utilise cet indicateur depuis plusieurs mois, une fois règlé "K" à sa conv...
Nicolas
8 years ago
T3 Velocity
T3 Velocity
16
Indicators
tatankayotanka As you can do to set a marker directly in the price property page and then view it such as m...
Nicolas It may be a good idea to discuss this in the forum instead. Please open a new topic in probu...
Wester Hi, is this more or less the same as the TTM Squeeze indicator (john carter)
rpreviteri Hi Nicolas, thanks a  loto for sharing your knowliedge, Wasn't the original momentum pinball...
air Thank you!  
elanoa Buonasera sig. Nicolas......sarebbe possibile far in modo che quando l'indicatore raggiunga ...
Pelle Nævestad Thanks Nicolas, this is a keeper!
Chicane23 Hi, when uploaded the WAE isnt showing histogram; only line. Is there a way to modify?
Nicolas Change the way the lines are displayed in the indicator settings window : histogram, lines, ...

Top