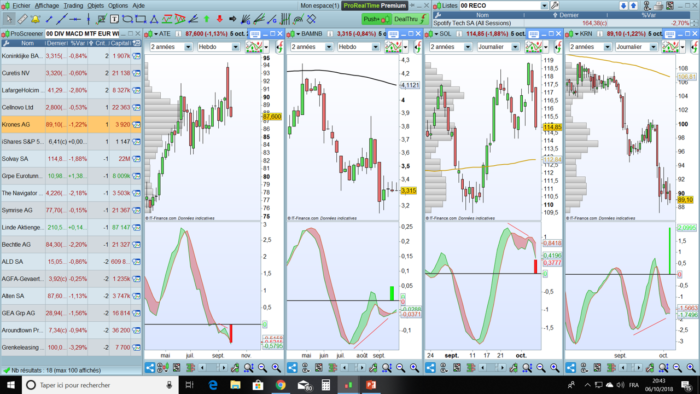
Here is a screener that allows you to identify positive and negative divergences of the MACD on a weekly or daily basis ;
The “signal” gives you the Time Frame and the nature of the divergence:
- 2 is a weekly positive divergence
- -2 is a weekly negative divergence
- 1 is a daily positive divergence
- -1 is a daily negative divergence
You can also tweek the code in order to combine both divergences at will;
Enjoy
|
1 2 3 4 5 6 7 8 9 10 11 12 13 14 15 16 17 18 19 20 21 22 23 24 25 26 27 28 29 30 31 32 33 34 35 36 37 38 39 40 41 42 43 44 45 46 47 48 49 50 51 52 53 54 55 56 57 58 59 60 61 62 63 64 65 66 67 68 69 70 71 72 73 74 75 76 77 78 79 80 81 82 83 84 85 86 87 88 89 90 91 92 93 94 95 96 97 98 99 100 101 102 103 104 105 106 107 108 109 110 111 112 113 114 115 116 117 118 119 120 121 122 123 124 125 126 127 128 129 130 131 132 133 134 135 136 137 138 139 140 141 142 143 144 145 146 147 148 149 150 151 152 153 154 155 156 157 158 159 160 161 162 163 164 165 166 167 168 169 170 171 172 173 174 175 176 177 |
// parameters timeframe (weekly) MinPrix = close >2.5 MinVolume = summation [10](average[23](volume)> 100000) =10 A=12 B=26 //C=9 // //MACD EMAshort1Week = exponentialaverage[A](close) EMAshort2Week = exponentialaverage[A](EMAshort1Week) DifferenceShortWeek = EMAshort1Week - EMAshort2Week ZeroLagShortWeek = EMAshort1Week + DifferenceShortWeek EMAlong1Week = exponentialaverage[B](close) EMAlong2Week = exponentialaverage[B](EMAlong1Week) DifferenceLongWeek = EMAlong1Week - EMAlong2Week ZeroLagLongWeek = EMAlong1Week + DifferenceLongWeek ZeroLagMACDWeek = ZeroLagShortWeek - ZeroLagLongWeek //signal1Week=ExponentialAverage[C](ZEROLAGMACDWeek) //signal2Week=ExponentialAverage[C](signal1Week) //DIFFERENCE2Week=signal1Week-signal2Week // //SignalMACDWeek=signal1Week+DIFFERENCE2Week //MyRsiweek = rsi[14](close)>55 /// Divergence MACD Week V=ZeroLagMACDWeek once RefCloseDownOldWeek=0 once RefMACDDownOldWeek=0 once RefCloseUpOldWeek=0 once RefMACDUpOldWeek=0 //once BarBullOld=0 //once BarBearOld=0 //Conditions to identify max and min c1=v[4]>v[2] and v[3]>v[2] and v[1]>v[2] and v>v[2] // down c2=v[4]<v[2] and v[3]<v[2] and v[1]<v[2] and v<v[2] // top //finding the double bottom if c1 then RefCloseDownNewWeek=close[2] RefMACDDownNewWeek=v[2] //BarBullNew=barindex[2] endif if RefCloseDownNewWeek<RefCloseDownOldWeek and RefMACDDownNewWeek>RefMACDDownOldWeek then //double slash next line if you don't needed the mark on a different window bulldivWeek=1 signal = 2 else bulldivWeek=0 endif //Finding the double top if c2 then RefCloseUpNewWeek=close[2] RefMACDUpNewWeek=v[2] //BarBearNew=barindex[2] endif if RefCloseUpNewWeek>RefCloseUpOldWeek and RefMACDUPNewWeek<RefMACDUpOldWeek then //double slash next line if you don't needed the mark on a different window beardivWeek=1 signal = -2 else beardivWeek=0 endif //grafica RefCloseDownOldWeek=RefCloseDownNewWeek RefMACDDownOldWeek=RefMACDDownNewWeek RefCloseUpOldWeek=RefCloseUpNewWeek RefMACDUpOldWeek=RefMACDUpNewWeek //BarBullOldWeek=BarBullNewWeek //BarBearOldWeek=BarBearNewWeek // timeframe (daily) D=12 E=26 //F=9 //REM MACD EMAshort1Day = exponentialaverage[D](close) EMAshort2Day = exponentialaverage[D](EMAshort1Day) DifferenceShortDay = EMAshort1Day - EMAshort2Day ZeroLagShortDay = EMAshort1Day + DifferenceShortDay EMAlong1Day = exponentialaverage[E](close) EMAlong2Day = exponentialaverage[E](EMAlong1Day) DifferenceLongDay = EMAlong1Day - EMAlong2Day ZeroLagLongDay = EMAlong1Day + DifferenceLongDay ZeroLagMACDDay = ZeroLagShortDay - ZeroLagLongDay //signal1Day=ExponentialAverage[F](ZEROLAGMACDDay) //signal2Day=ExponentialAverage[F](signal1Day) //DIFFERENCE2Day=signal1Day-signal2Day // //SignalMACDDay=signal1Day+DIFFERENCE2Day /// Divergence MACD Day W=ZeroLagMACDDay once RefCloseDownOldDay=0 once RefMACDDownOldDay=0 once RefCloseUpOldDay=0 once RefMACDUpOldDay=0 //once BarBullOld=0 //once BarBearOld=0 //Conditions to identify max and min d1=w[4]>w[2] and w[3]>w[2] and w[1]>w[2] and w>w[2] // down d2=w[4]<w[2] and w[3]<w[2] and w[1]<w[2] and w<w[2] // top //finding the double bottom if d1 then RefCloseDownNewDay=close[2] RefMACDDownNewDay=w[2] //BarBullNewDay=barindex[2] endif if RefCloseDownNewDay<RefCloseDownOldDay and RefMACDDownNewDay>RefMACDDownOldDay then //double slash next line if you don't needed the mark on a different window bulldivDay=1 signal = 1 else bulldivDay=0 endif //Finding the double top if d2 then RefCloseUpNewDay=close[2] RefMACDUpNewDay=w[2] //BarBearNew=barindex[2] endif if RefCloseUpNewDay>RefCloseUpOldDay and RefMACDUPNewDay<RefMACDUpOldDay then //double slash next line if you don't needed the mark on a different window beardivDay=1 signal = -1 else beardivDay=0 endif //grafica RefCloseDownOldDay=RefCloseDownNewDay RefMACDDownOldDay=RefMACDDownNewDay RefCloseUpOldDay=RefCloseUpNewDay RefMACDUpOldDay=RefMACDUpNewDay //BarBullOld=BarBullNew //BarBearOld=BarBearNew //////////////////////////////////////////////// SCREENER [((beardivWeek or beardivDay or bulldivWeek or bulldivDay)) and MinPrix and MinVolume ](signal) |
Share this
No information on this site is investment advice or a solicitation to buy or sell any financial instrument. Past performance is not indicative of future results. Trading may expose you to risk of loss greater than your deposits and is only suitable for experienced investors who have sufficient financial means to bear such risk.
ProRealTime ITF files and other attachments :PRC is also on YouTube, subscribe to our channel for exclusive content and tutorials





Hello
Thanks for sharing your code, I will put in a more complex code.
You can reduce CPU usage and time for screening by not executing the code with intrusction if
MinPrix = close >2.5
MinVolume = summation [10](average[23](volume)> 100000) =10
If MinPrix and MinVolume then
….
Endif
Hi Kris,
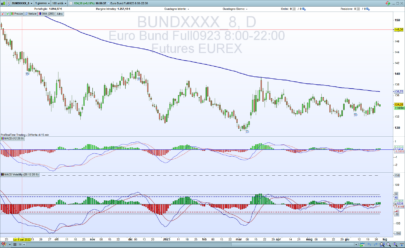
I have imported the screen. I don’t see any instrument loaded under this screen. also, how to get the chart like your screenshot?
Regards,
Bala
Hi Bala,
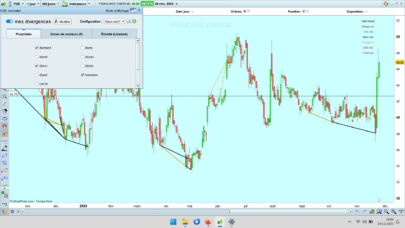
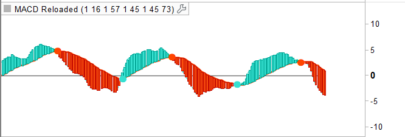
you need first to install ZeroLagMACDWeek indicator and then add on it the divergence indicator
Hi, thank you very much for this very useful screener. I would like to get another very close screener based on HIDDEN DIVERGENCES usable with intraday timeframes (5,15 min, H1…). Is it possible to simultaneously have more than 2 timeframe columns on a shorter list of assets ?As I do not know (yet) how to program PRT and to avoid mistakes, could you help me. Thank you in advance.
Hello, I uploaded correctly the screener and it is not selecting any. Is it normal? cheers
Hello, where do you find the ZeroLagMACDWeek indicator? You only posted the mtf-macd-divergence indicator. Thanks
Good morning! I was trying to tweek the code in the way as to set it for intraday (1 Min to 60 Min) usage, but unfortunately with very limited success! Can anyone be of help? Thank you very much in advance!