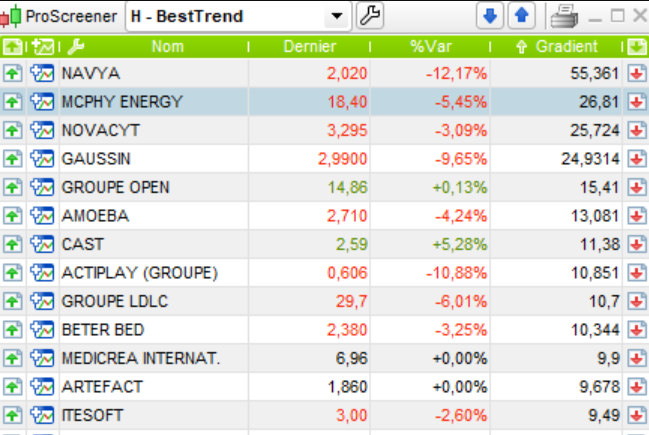
This screener return the list of the different stocks following a “trend following” pattern
They are order by their percentage earning per unit of time (for example if you have 20 and you choose day, it means the stock is increasing by 20% a day more or less)
NB : the screener takes a bit of time for calculating but it does the job
NB2 : The screener is based on SuperTrend for detecting going up values so be careful because sometimes some values can have already reached their highest or are on their way to change direction
NB3 : my screeners are here to help you and make work easier by making selections but don t forget your analyses 😉
|
1 2 3 4 5 6 7 8 9 10 11 12 13 14 15 16 17 18 19 20 21 22 23 24 25 26 27 28 29 30 31 32 33 34 35 36 37 38 39 40 41 42 43 44 45 46 47 48 49 50 51 52 53 54 55 56 57 58 59 |
// Variables a changer minPercent = 3 // Supertrend is green cSP = close > Supertrend[3,10] // Find superTrend first green point tendency nbIter = 0 while close[nbIter] > Supertrend[3,10][nbIter] nbIter = nbIter+1 wend // Find gradient gradient = 0 if (nbIter > 1) then // Find number of active green SuperTrend points if (round(nbIter/2) <> nbIter/2) then nbIter = (nbIter + 1) endif halfIter = nbIter/2 // Calculate last median point y1 = 0 for i = 0 to halfIter-1 y1 = y1 + (close[i]+open[i])/2 next y1 = y1 / halfIter // Calculate oldest gradient point y0 = 0 for i = halfIter to nbIter-1 y0 = y0 + (close[i]+open[i])/2 next y0 = y0 / halfIter // Calculate gradient gradient = (y1-y0)/y0/halfIter*100 // Gradient condition cGradient = gradient > minPercent endif // Volume condition avgVol = average[20](volume) sum = 0 for i=0 to 20 if (volume[i] < avgVol*10) then sum = sum + volume[i] else sum = sum + avgVol endif next avgVol = sum / 21 cVol = avgVol > 1000 // Screener Screener [cSP and cGradient and cVol](gradient as "Gradient") |
Share this
No information on this site is investment advice or a solicitation to buy or sell any financial instrument. Past performance is not indicative of future results. Trading may expose you to risk of loss greater than your deposits and is only suitable for experienced investors who have sufficient financial means to bear such risk.
ProRealTime ITF files and other attachments :PRC is also on YouTube, subscribe to our channel for exclusive content and tutorials



salut merci pour ton partage et ton travaille
Hi Vivien René
I just discovered your “Ordered trend-following stocks Screener”. Great work !
Do you know the indicators system PRT Bands ?… recently added as a native indicator in ProRealTime
It works quite well.
There are now the 4 instructions PRTBANDSUP; PRTBANDSDOWN; PRTBANDSMEDIUMTERM; PRTBANDSSHORTTERM available for this indicator, in PRT Software (and PRT/Binck in France since this morning) (but we are still waiting for PRT/IG and PRT/InteractiveBrokers)
Could you develop the same kind of screener based on PRT Bands ?
Thank you in advance
https://www.prorealcode.com/topic/prt-bands-trend-following-prorealtime/
PS. In order to identify Up trends and Down trends, one can use these conditions :
//************************************************
if close crosses over PRTBandsUp and trend=0 then
trend=-1
r=255
g=0
endif
signal = trendtrend[1] //Trend Reversal
// Up Trend :
if signal and trend>0 then
……
// Down Trend
elsif signal and trend<0 then
……
endif
//************************************************