Author: financnipi
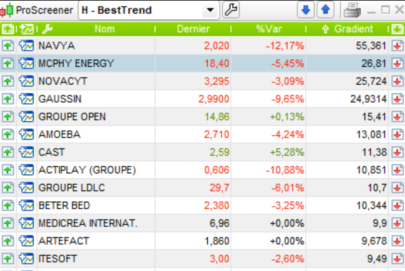
RSI is an indicator that can be sais oversold or overbought, and this may foresee some trend reversals. In this example, we will pick up all the stocks “oversold”, considering hourly bars.
“Oversold” is defined by RSI < 30. This is as much significant as the RSI is near of the zero line.
So we will build a screener that returns all the stocks where RSI < 30 and we will keep thoose that have the lowest RSI values.
|
1 2 3 4 5 6 7 8 |
REM Calculate the RSI indicator on 14 hourly bar a1=open<dclose(1) a2=open[1]<dclose(2) REM Our filter condition: RSI < 30 REM Sorting criteria: myRSI SCREENER [a1 and a2 ] |
Share this
No information on this site is investment advice or a solicitation to buy or sell any financial instrument. Past performance is not indicative of future results. Trading may expose you to risk of loss greater than your deposits and is only suitable for experienced investors who have sufficient financial means to bear such risk.
ProRealTime ITF files and other attachments :PRC is also on YouTube, subscribe to our channel for exclusive content and tutorials




Hi, is it possible to adjust this screener for 5 min timeframe instead of daily?