Resting Above 52-Week Lows

Resting Above 52-Week Lows

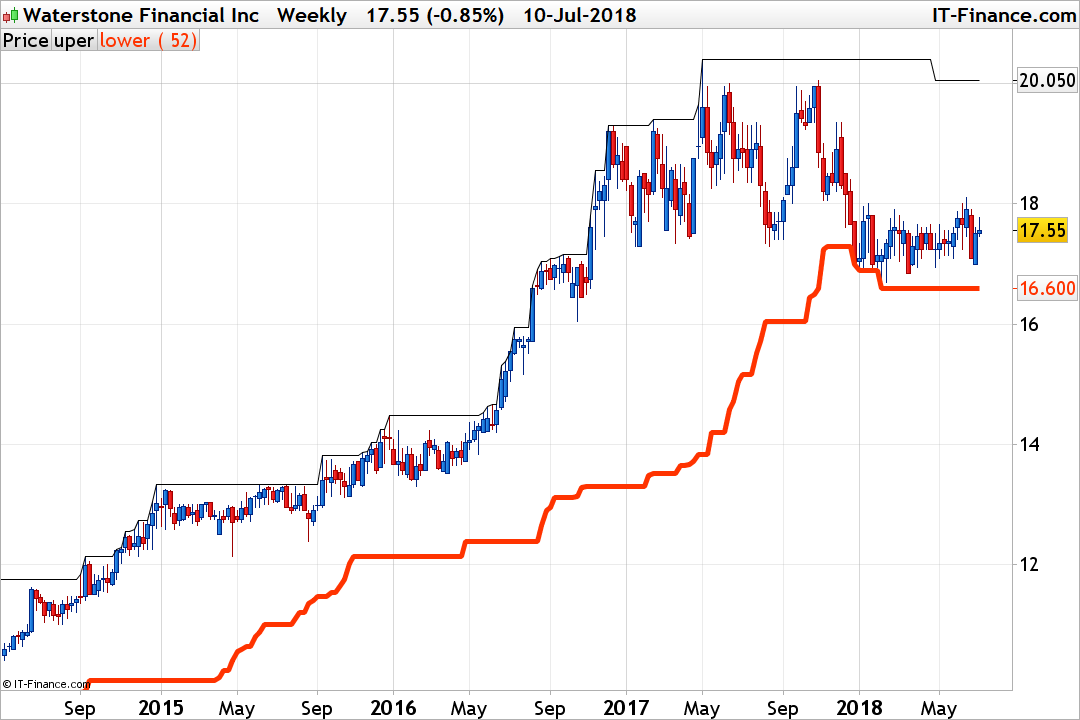
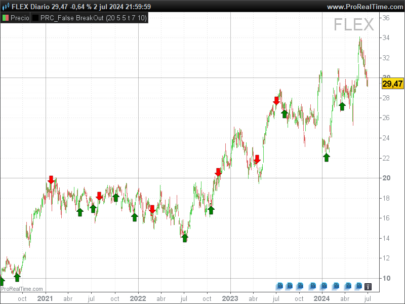
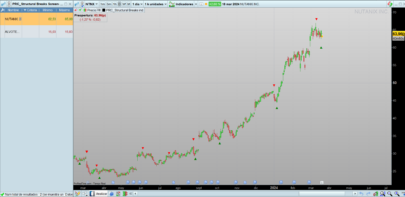
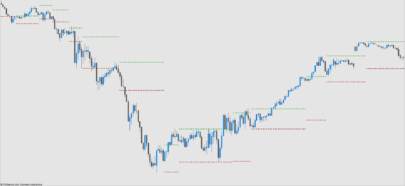
The screener will find stocks that are trading near their 52-Week Lows.

The price distance is in percent and freely adaptable with the “percent” variable setting.

The lowest lows must be the same since 20 bars.


Share this

Risk disclosure:

No information on this site is investment advice or a solicitation to buy or sell any financial instrument. Past performance is not indicative of future results. Trading may expose you to risk of loss greater than your deposits and is only suitable for experienced investors who have sufficient financial means to bear such risk.

ProRealTime ITF files and other attachments : How to import ITF files into ProRealTime platform?

PRC is also on YouTube, subscribe to our channel for exclusive content and tutorials
avatar
Register or

Likes

avatar avatar avatar avatar
Related users ' posts
Gaspare Ciao Ivan si puo' inserire una strategia su questo indicatore per ottimizzare le variabil...
lee Thank you!
jacquesgermain sì da aggiungere
Maik2404 auf welchen Wert muss ich die Kompresionsperiode stellen?
jacquesgermain — Période de compression : ce paramètre détermine la période de rétrospection utilisée pour ...
Germano77 hello, thx for sharing, but wich broker do you use? At IG I got the notification "automatic...
Musiar Hi Davide, You have done a great job: I modified a bit your strategy for Nasdaq, and now I ...
Maik2404 Musiar können sie den code des automatischen systems teilen.
YvesRobert Hello davidelaferla, how do you put a stop loss and where exactly ? the moment you enter on ...
Hypersimo Buongiorno Davide a quale distanza inserire stop loss e tp nella strategia? grazie
beanpole Thank you for sharing the code. I applied it to the "CAC40 Index" on Euronext market on a da...
luxrun Hi Josè I can't load the itf calculated tool. The platform gives me an error "incorrect form...
Stanley
1 year ago
Amazon / Alibaba
Amazon / Alibaba
0
Calculated instruments
emism12 Looks great, personally I don't use automated trading for single stocks, but is definitely o...
adconsulting Ciao, I look that the strategy (backtest 50 k), works very good wiht US 500 CASH 1 EURO in...
Kev Monaghan The equity curve looks to follow the stock price almost perfectly, Have you tested on stock ...
Roland57800 Bonjour Noobywan, si je comprends bien l'utilisation de ce code que je trouve particulièr...
Noobywan Bonjour, quand la question a été posée dans le forum à celui qui avait fait la requête en am...
Fabian This Code draws only a retangle if the condition has been confirmed and NOT before (in that ...
smarttrader1 hi, can you improve on this ? can you make this flag screeener for day trading, I want to be...
Nicolas Please open a new topic in the proscreener forum for this specific query. Please provide exp...
NHGambler Nice screener. Only thing is I wonder if this is aimed more at small/medium/large caps? I ...
Manu L. Bonjour Nicolas, j'ai créé un screener avec l'aide à la prog en TF weekly mais je voudrai...
wtangsiri C'est exactement le même signal que donne le croisement et le décroisement de deux EMA (7 et...
PHAN100 bonjour, j'ai un bug sur le programme recopié prorealtime me dit qu'il y a un problème à ...
PHAN100 bonjour, bravo à l'auteur pour cet indicateur visuel sur le graphique, il nous reste à va...
mickey992 salut merci pour ton partage et ton travaille
patapouf Hi Vivien René I just discovered your “Ordered trend-following stocks Screener”. Great work...
yeoreum Thank you very much for the screener, it reminds me on Minervini VCP. How to change th...
reecet any codes like this but in minutes and hours rather than days?
PHAN100 bonjour, je viens de tester ce screener, je constate une anomalie...il ne renvoie pas l'e...
Oxxoz Re bonjour Vivien, Il me smeble que 3 mois, c'est 60 séances. Cordialement,
Vinks_o_7 thanks ...and It can be used on a monthly and weekly basis by changing just the duration in ...

Top