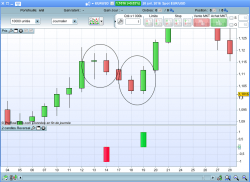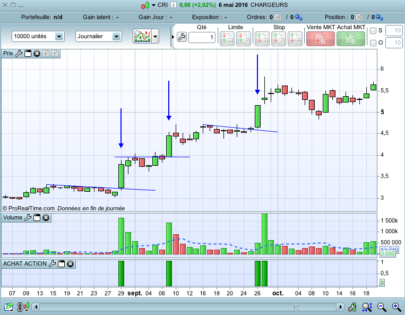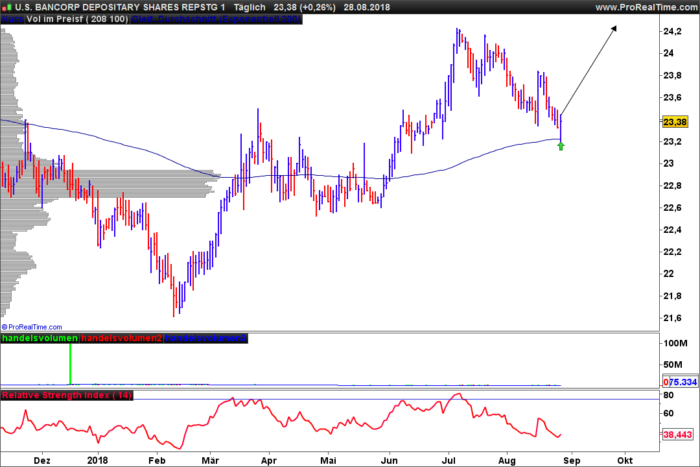
This simple stock screener test a Volume peak appearing with a bullish candlestick rebounding on a 200 periods SMA or EMA on the same period.
|
1 2 3 4 5 6 7 8 9 10 11 12 13 14 15 16 17 18 19 20 |
// Beispielcode Screener// von Markus Schulze // found on facebook optionschein gruppe if (volume > (1.1 * average [10](volume))) and average[10](volume) > 50000 then volpeak =1 endif BullRev = 0 if (close > average[200](close)) and low < average[200](close) and open < close then BullRev = 1 elsif (close > exponentialaverage[200](close)) and low <exponentialaverage[200](close) and open < close then BullRev = 1 else BullRev = 0 endif DownTrend = 0 if (low < low[1]) and (low[1]) < low[2] then DownTrend = 1 endif Screener[VolPeak and BullRev and DownTrend](volume as "volume") |
Share this
No information on this site is investment advice or a solicitation to buy or sell any financial instrument. Past performance is not indicative of future results. Trading may expose you to risk of loss greater than your deposits and is only suitable for experienced investors who have sufficient financial means to bear such risk.
ProRealTime ITF files and other attachments :
Find other exclusive trading pro-tools on ![]()
PRC is also on YouTube, subscribe to our channel for exclusive content and tutorials