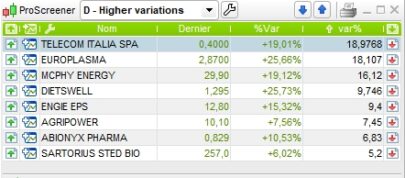
In the world of technical analysis, “Free Bars” are a rare but powerful price pattern. A Free Bar is a candlestick that is completely outside the bounds of the Keltner Channels, indicating a strong directional move that can be followed by significant price action. This article will guide you through setting up a ProScreener in ProRealTime to identify these Free Bars across any market.
What Are Free Bars?
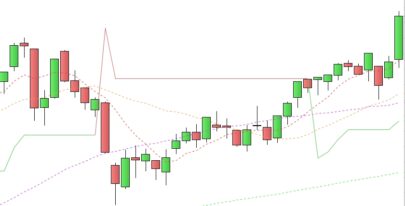
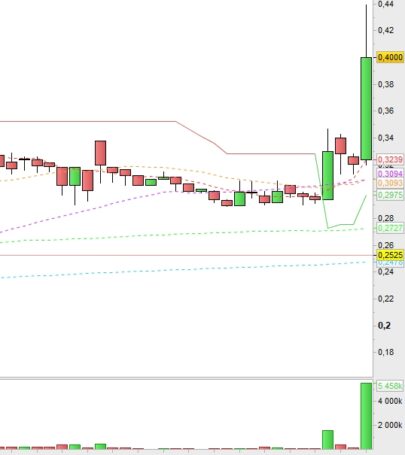
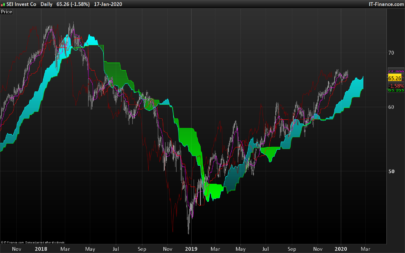
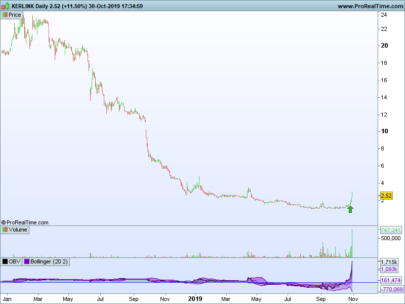
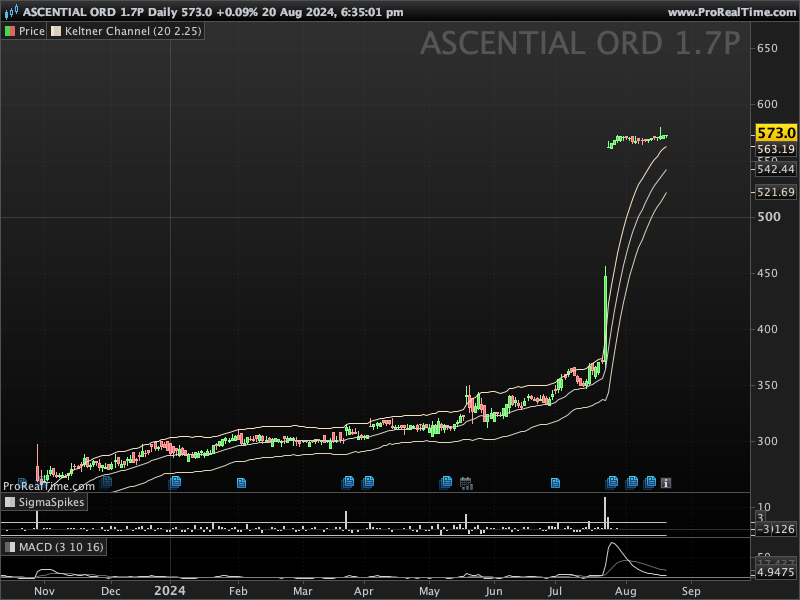
Free Bars occur when a candlestick’s entire range—high to low—trades completely above or below the Keltner Channel. This is typically a signal of strong momentum, either to the upside or downside, and can indicate the potential for continued movement in that direction. Traders often look for these patterns after periods of consolidation or low volatility as a sign of a new trend emerging.
Setting Up the Screener
To scan for Free Bars using ProScreener in ProRealTime, you’ll need to understand how to set up and customize ProScreeners using the ProBuilder language. Here’s how you can do it:
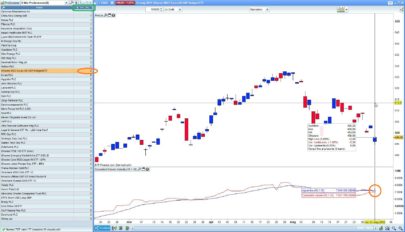
- Keltner Channel Calculation: The Keltner Channel is typically calculated using a moving average (usually the Exponential Moving Average or EMA) and the Average True Range (ATR). The upper and lower bounds of the Keltner Channel are derived as follows:
- Upper Band = EMA + (ATR * Multiplier)
- Lower Band = EMA – (ATR * Multiplier)
For our screener, we’ll use the standard settings of a 20-period EMA and a 2x ATR multiplier.
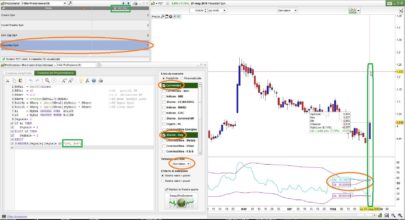
- Identifying Free Bars: To identify Free Bars, the screener must check that the entire range of the current bar is above the upper Keltner Channel or below the lower Keltner Channel:
- A Free Bar above: Low of the bar is greater than the Upper Keltner Band.
- A Free Bar below: High of the bar is lower than the Lower Keltner Band.
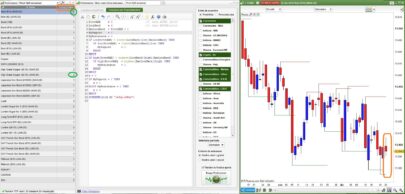
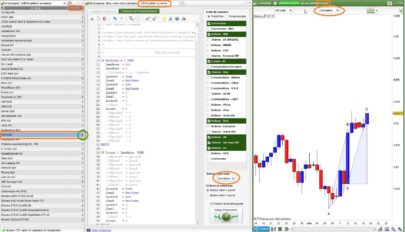
ProScreener Code Implementation
Here’s how you can write the ProScreener code to identify Free Bars in ProRealTime:
|
1 2 3 4 5 6 7 8 9 10 11 12 13 14 15 16 17 |
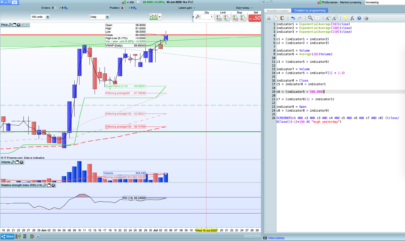
ATR = AverageTrueRange[20](close) ATRM = 2.25 * ATR MLine = ExponentialAverage[20](close) UChannel = MLine + ATRM LChannel = MLine - ATRM FreeBarUp = Low > UChannel FreeBarDown = High < LChannel IF Close > MLine THEN C = 1 ELSE C = -1 ENDIF SCREENER[FreeBarUp OR FreeBarDown](C AS "Position") |
Conclusion
The Free Bar pattern is a powerful tool for identifying strong market momentum. By implementing the above ProScreener code in ProRealTime, you can automatically scan multiple instruments across different timeframes to find these unique and potentially profitable trading opportunities.
Remember, while Free Bars can indicate strong market moves, it’s important to consider the broader market context and other technical indicators before making trading decisions. Happy trading!
Share this
No information on this site is investment advice or a solicitation to buy or sell any financial instrument. Past performance is not indicative of future results. Trading may expose you to risk of loss greater than your deposits and is only suitable for experienced investors who have sufficient financial means to bear such risk.
ProRealTime ITF files and other attachments :
Find other exclusive trading pro-tools on ![]()
PRC is also on YouTube, subscribe to our channel for exclusive content and tutorials