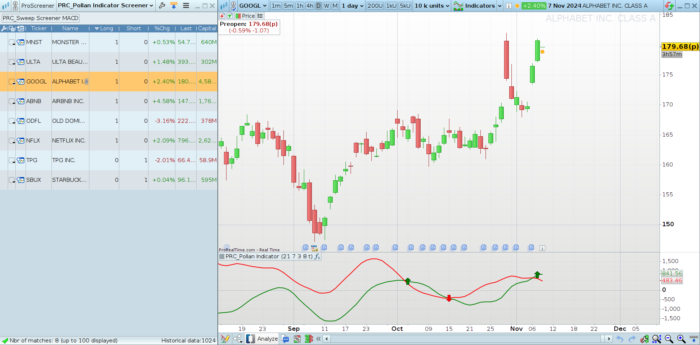
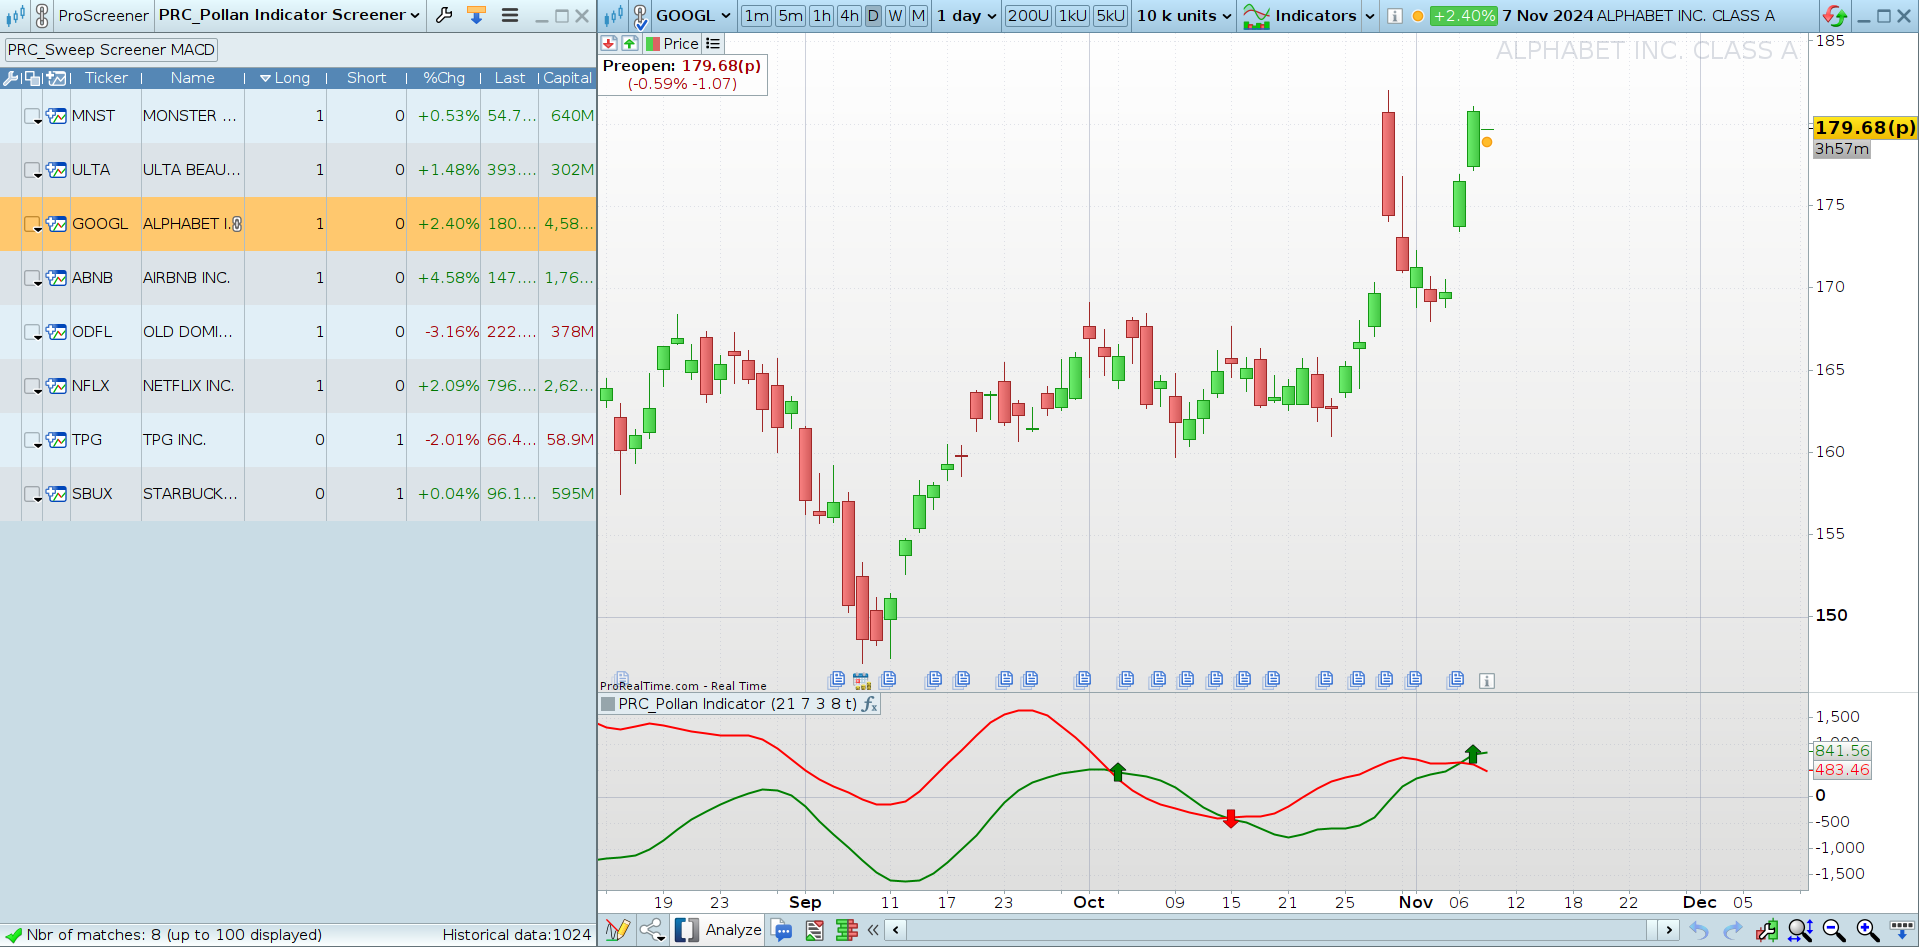
The Pollan Screener is a tool designed to quickly identify buy and sell opportunities across multiple financial assets, based on the signals generated by the Pollan Indicator. This screener helps detect key moments when the market may be in overbought or oversold conditions, providing signals that assist traders in making informed entry and exit decisions.
For a complete explanation of how the Pollan Indicator works, you can refer to the detailed article here.
Pollan Screener Configuration
The screener is configured with the following parameters, which can be adjusted according to the trader’s preferences:
- CCIper: The period for the Commodity Channel Index (CCI), defaulted to 14.
- RSIper: The period for the Relative Strength Index (RSI), defaulted to 14.
- MaPeriod: The period for the Moving Average used to smooth the calculated differences between the CCI and RSI, with a default value of 2.
- koef: The coefficient that defines how many historical periods are taken into account in the calculations, with a default of 8.
- showarrows: A binary value that, when active (set to 1), enables the display of arrows on the chart indicating possible buy and sell signals.
How the Pollan Screener Works
The screener operates as follows:
- Difference Calculation: Differences between the CCI and RSI are calculated and then smoothed using an adjustable moving average.
- Signal Conditions:
- A buy signal (Long) is generated when the
Diff1difference crosses aboveDiff2. - A sell signal (Short) is produced when
Diff1crosses belowDiff2.
- A buy signal (Long) is generated when the
- Signal Display: Depending on the value of
showarrows, the screener will show arrows on the chart that indicate possible entry and exit points.
This screener facilitates the analysis of multiple assets simultaneously, allowing the trader to detect opportunities in a list of values that meet the set buy or sell conditions.
Pollan Screener Code
Below is the complete code for the Pollan Screener, ready for use:
|
1 2 3 4 5 6 7 8 9 10 11 12 13 14 15 16 17 18 19 20 21 22 23 24 25 26 27 28 29 30 31 32 33 34 35 36 37 38 39 40 41 42 43 44 45 46 47 48 49 50 51 52 53 54 55 56 57 58 59 60 61 62 63 64 65 66 67 68 69 70 71 72 73 74 75 76 77 78 79 80 81 82 83 84 85 86 |
//---------------------------------------------------------------// //PRC_Pollan Indicator SCREENER //version = 0 //08.11.24 //Iván González @ www.prorealcode.com //Sharing ProRealTime knowledge //---------------------------------------------------------------// //-----Inputs----------------------------------------------------// CCIper = 14 RSIper = 14 MaPeriod = 2 koef = 8 showarrows = 1 //---------------------------------------------------------------// //-----Components Calculation------------------------------------// i=8 //---Diff. CCI-RSI a=cci[CCIper](typicalprice)[i]-rsi[rsiper](typicalprice)[i] a1=cci[CCIper](typicalprice)[i-1]-rsi[rsiper](typicalprice)[i+1] a2=cci[CCIper](typicalprice)[i-2]-rsi[rsiper](typicalprice)[i+2] a3=cci[CCIper](typicalprice)[i-3]-rsi[rsiper](typicalprice)[i+3] a4=cci[CCIper](typicalprice)[i-4]-rsi[rsiper](typicalprice)[i+4] a5=cci[CCIper](typicalprice)[i-5]-rsi[rsiper](typicalprice)[i+5] a6=cci[CCIper](typicalprice)[i-6]-rsi[rsiper](typicalprice)[i+6] a7=cci[CCIper](typicalprice)[i-7]-rsi[rsiper](typicalprice)[i+7] a8=cci[CCIper](typicalprice)[i-8]-rsi[rsiper](typicalprice)[i+8] //---Diff. RSI-CCI b=rsi[rsiper](typicalprice)[i]-cci[CCIper](typicalprice)[i] b1=rsi[rsiper](typicalprice)[i-1]-cci[CCIper](typicalprice)[i+1] b2=rsi[rsiper](typicalprice)[i-2]-cci[CCIper](typicalprice)[i+2] b3=rsi[rsiper](typicalprice)[i-3]-cci[CCIper](typicalprice)[i+3] b4=rsi[rsiper](typicalprice)[i-4]-cci[CCIper](typicalprice)[i+4] b5=rsi[rsiper](typicalprice)[i-5]-cci[CCIper](typicalprice)[i+5] b6=rsi[rsiper](typicalprice)[i-6]-cci[CCIper](typicalprice)[i+6] b7=rsi[rsiper](typicalprice)[i-7]-cci[CCIper](typicalprice)[i+7] b8=rsi[rsiper](typicalprice)[i-8]-cci[CCIper](typicalprice)[i+8] //---------------------------------------------------------------// //-----Switch Koef-----------------------------------------------// if koef >=8 then tt1max = a+a1+a2+a3+a4+a5+a6+a7+a8 tt2min = b+b1+b2+b3+b4+b5+b6+b7+b8 elsif koef = 7 then tt1max = a+a1+a2+a3+a4+a5+a6+a7 tt2min = b+b1+b2+b3+b4+b5+b6+b7 elsif koef = 6 then tt1max = a+a1+a2+a3+a4+a5+a6 tt2min = b+b1+b2+b3+b4+b5+b6 elsif koef = 5 then tt1max = a+a1+a2+a3+a4+a5 tt2min = b+b1+b2+b3+b4+b5 elsif koef = 4 then tt1max = a+a1+a2+a3+a4 tt2min = b+b1+b2+b3+b4 elsif koef = 3 then tt1max = a+a1+a2+a3 tt2min = b+b1+b2+b3 elsif koef = 2 then tt1max = a+a1+a2 tt2min = b+b1+b2 elsif koef = 1 then tt1max = a+a1 tt2min = b+b1 elsif koef = 0 then tt1max = a tt2min = b endif //---------------------------------------------------------------// //---------------------------------------------------------------// Diff1 = average[maperiod](tt1max) Diff2 = average[maperiod](tt2min) //---------------------------------------------------------------// //---------------------------------------------------------------// if showarrows then if Diff1 >= Diff2 and Diff1[1] < Diff2[1] then arrowUp=1 arrowDw=0 elsif Diff1 <= Diff2 and Diff1[1] > Diff2[1] then arrowDw=1 arrowuP=0 else arrowUp=0 arrowDw=0 endif endif //---------------------------------------------------------------// screener[arrowUp or arrowDw](arrowUP as "Long",arrowDw as "Short") |
Interpreting the Signals
- Long (Buy): A “Long” signal in the screener indicates a potential buying opportunity.
- Short (Sell): A “Short” signal suggests a potential selling opportunity.
Both signals can serve as a starting point for further analysis and are recommended for traders who want to use this screener in combination with other technical analysis tools.
Conclusion
The Pollan Screener is an effective tool for identifying potential buy and sell opportunities in the market. Based on the Pollan Indicator, it enables quick analysis across multiple assets. Don’t forget to check out the complete article on the Pollan Indicator here for more details on its functionality and advanced settings.
Share this
No information on this site is investment advice or a solicitation to buy or sell any financial instrument. Past performance is not indicative of future results. Trading may expose you to risk of loss greater than your deposits and is only suitable for experienced investors who have sufficient financial means to bear such risk.
ProRealTime ITF files and other attachments :PRC is also on YouTube, subscribe to our channel for exclusive content and tutorials


Thank you!