Hello
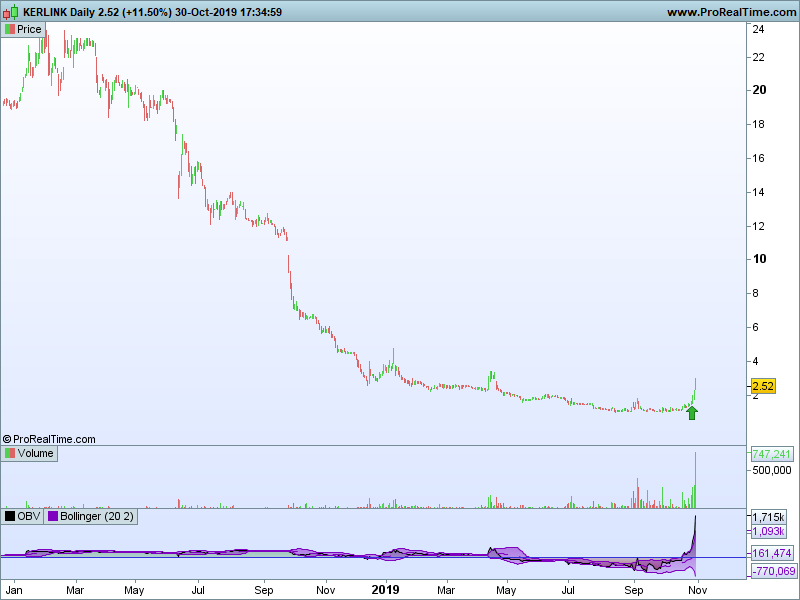
I would like to share my startup screener to detect accumulation and possible breakout inspired by Stan Weinstein and Wyckoff logic.
Why investing in startup?
Because it the most profitable strategy in term of % of gain and in time invested
The idea is to find an all time low and high volume activity (Bollinger Band breakout of OBV).
I personnaly scan startup and find in which business the company is active
Good luck and I am opened to feedback.
|
1 2 3 4 5 6 7 8 9 10 11 12 13 14 15 16 17 18 19 20 21 22 |
//ATL All time low identification for i = 1 to barindex If low[i]<ATL or ATL=0 then ATL=Low else ATL=ATL[1] Endif Next //High volume activity myOBV = OBV(close) avgOBV=average[20](myOBV) stdevOBV=2*std[20](myOBV) BollUp = avgOBV+stdevOBV //ATL zone and volume activity c1=close<2*ATL c2=myOBV>BollUP screener[ c1 and c2 ] |
Share this
No information on this site is investment advice or a solicitation to buy or sell any financial instrument. Past performance is not indicative of future results. Trading may expose you to risk of loss greater than your deposits and is only suitable for experienced investors who have sufficient financial means to bear such risk.
ProRealTime ITF files and other attachments :PRC is also on YouTube, subscribe to our channel for exclusive content and tutorials

Thank you Yannick for sharing with us.
You say StartUp … are you looking for new business start ups or the the start of an UP?? 🙂
Aha now I have run the Screener, I can answer my own question … the start of an UP … as I can see BAe Systems in my results and a few other names I recognise over the years of trading.
Cheers
Hello Yannick. Thank you for sharing.
You can replace your “All time low identification” (“for … next” lines) with one command:
ATL = lowest[BarIndex](low)
Good Luck
Hi
Thanks for code optimisation, it should faster@Avram
@GraHal I run the screener on France alternext or similar market (startup or mining companies). The screener is designed mainly for start ups company at the begining of the start up of the upside trend , when “the death valley” of cash flow is met . This pattern occurs at different stages : prototype, first sales, new market introduction. The bottom of the valuation of a company is met
OBV is expeted to be negative, because seeder and first investors before Initial Public Offering must have sold their shares for profit taking at the seed stage or different rounds of funding.
The psychlogy behind this pattern is : at IPO, the company is losing money, everyone is selling, selling, the company lose money…… then the free cash flow becomes positive or expected earning. Some funds or insiders are buying , which indicated high volume activity. Then trend is launch , the price rise, and OBV is positive : more buyer than seller.
I have learned this pattern with Twitter example last year in 2016 or with the financial education that I got with my personal startup project.
Regards
https://www.forbes.com/sites/martinzwilling/2013/02/18/10-ways-for-startups-to-survive-the-valley-of-death/
This screener should as well with mining companies with strong cycles (exploration, development, mining)
https://s1.qwant.com/thumbr/0x380/2/3/f57b93ba822c9b393705139451f5e304b431b2fe988f7c68ec885dbe6d1c4b/seven-strategies-for-rare-earths-hopefuls-nov-2012-greenfields-research-47-638.jpg?u=http%3A%2F%2Fimage.slidesharecdn.com%2Fsevenstrategiesforrareearthscompaniesjohnpsykes-13525514599671-phpapp01-121110064525-phpapp01%2F95%2Fseven-strategies-for-rare-earths-hopefuls-nov-2012-greenfields-research-47-638.jpg%3Fcb%3D1380052920&q=0&b=1&p=0&a=1
Hola,
Muy interesante la apreciación sobre empresas IPO, similar patrón de comportamiento lo he observado en acciones americanas nuevas (Tradeweb, Pinterest, )….la utilización del OBV para la detección de estas empresas es muy efectivo, particularmente, uso una modificación del OBV que captura el inicio de fases alcistas en gráfico diario y semanal. Tambien el indicador (al que he llamado remora), actua como un filtro efectivo para estrategias tendenciales.
como puedo colgar una imagen?
Hello JJ Tec, we can speak in english here (puedes hablar en espanol pero toda la gente habla ingles)
https://www.prorealcode.com/topic/startup-atl-obv-wickoff-weinstein/
nice, thanks
why can not use this code? when i copied after that paste in ambiroker it was run.
We do not provide any code for Amibroker on our website. All codes are to be used with the ProRealTime trading platform.
Please find an updated version with stocks below 200 average
//ATL All time low identification
ATL = lowest[BarIndex](low)
//High volume activity
myOBV = OBV(close)
avgOBV=average[20](myOBV)
stdevOBV=2*std[20](myOBV)
BollUp = avgOBV+stdevOBV
mm200=average[200](close)
//ATL zone and volume activity
c1=closeBollUP
c3=close<mm200
screener[ c1 and c2 and c3 ]
Yannick,
missing line of condition 2 “c2=myOBV>BollUP”
This logic does not make sense. we can’t be below ATL ever.
you probably mean “New low within X days where X is 30, 60, 90, 180, 360” and u never use ATL in your latest update anyways