Structural Breaks: An Advanced Trading Indicator
Today, we introduce the “Structural Breaks” indicator and screener.
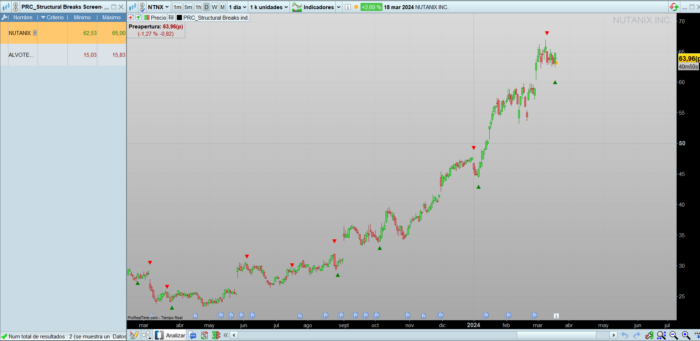
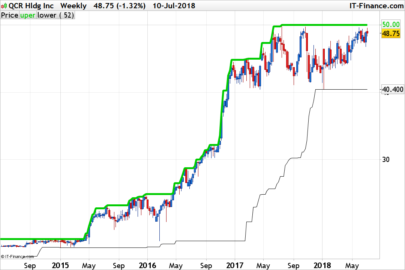
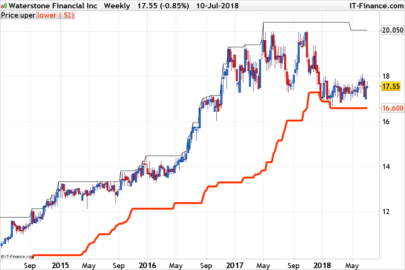
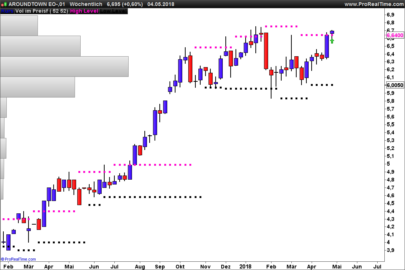
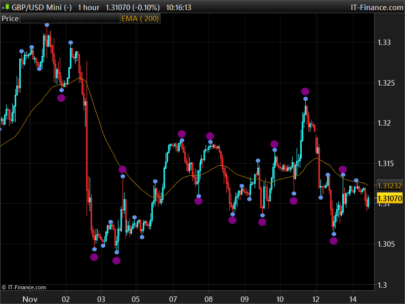
This indicator focuses on identifying bullish and bearish trading opportunities by detecting supply and demand patterns and using pivots to mark critical price zones.
Indicator Configuration
The “Structural Breaks” indicator overlays directly on the price chart, providing an intuitive and straightforward visual interpretation of trading signals. Among its configurable features are:
- Pivot Lookup: Defines the range within which the indicator will search for pivot points, essential for identifying potential changes in trend.
Functions and Detection Logic
The core of the indicator lies in its ability to distinguish between bullish and bearish movements through a series of logical functions that examine the candle structure in relation to identified pivots. These functions include:
- Bullish/Bearish OB Detection: Using the candle pattern, the indicator identifies bullish and bearish OB (Order Block) that suggest a potential change in market direction.
- Pivots: Through high and low pivot points, the indicator establishes reference zones that help confirm the detected OB signals.
Interpretation of Signals
The signals generated by the “Structural Breaks” indicator are presented visually for easy interpretation:
- Bearish Triangles: Indicate a sell signal and appear above the price bar when a bearish OB is identified in relation to pivots.
- Bullish Triangles: Suggest a buy signal and are positioned below the price bar when a bullish OB is detected.
Potential Uses and Strategies
This indicator lends itself to a variety of trading strategies, from intraday operations to longer-term trend analysis. Some applications include:
- Precise Entries: Use bullish and bearish signals to determine optimized entry points.
- Risk Management: Establish stop-loss and take-profit levels around the identified pivots to improve the risk-reward ratio.
- Trend Confirmation: Combine with other indicators to validate the strength and direction of the current trend.
Indicator code
|
1 2 3 4 5 6 7 8 9 10 11 12 13 14 15 16 17 18 19 20 21 22 23 24 25 26 27 28 29 30 31 32 33 34 35 36 |
//////////////////////////////////////////////////////////////// //PRC_Structural Breaks indicator //version = 0 //19.03.24 //Iván González @ www.prorealcode.com //Sharing ProRealTime knowledge //////////////////////////////////////////////////////////////// //------------Inputs-----------------------------------------// prd = 1 //pivot length //------------Bullish and bearish conditions-----------------// isObUp = close[1]<open[1] and close>open and close > high[1] isObDown = close[1]>open[1] and close < open and close < low[1] //------------Pivots low-------------------------------------// if low > low[prd] and lowest[prd](low) > low[prd] and low[prd] < lowest[prd](low)[prd+1] then $pl[z+1] = low[prd] $plx[z+1] = barindex[prd] z = z + 1 endif //------------Pivots high------------------------------------// if high < high[prd] and highest[prd](high)<high[prd] and high[prd]>highest[prd](high)[prd+1] then $ph[t+1]=high[prd] $phx[t+1]=barindex[prd] t=t+1 endif //----------Bearish Signal-----------------------------------// bearishTriangle = isObDown and ((max(high, high[1]) > $ph[t] and close < $ph[t]) or (max(high, high[1]) > $ph[t][1] and close < $ph[t][1])) //----------Bullish Signal-----------------------------------// bullishTriangle = isObUp and ((min(low, low[1]) < $pl[z] and close > $pl[z]) or (min(low, low[1]) < $pl[z][1] and close > $pl[z][1])) //----------Draw Signals-------------------------------------// if bullishTriangle then drawtext("▲",barindex,low-tr)coloured("green") elsif bearishTriangle then drawtext("▼",barindex,high+tr)coloured("red") endif return //$pl[z] as "Pivot low", $ph[t] as "Pivot high" |
Screener code
|
1 2 3 4 5 6 7 8 9 10 11 12 13 14 15 16 17 18 19 20 21 22 23 24 25 26 27 28 29 30 31 |
//////////////////////////////////////////////////////////////// //PRC_Structural Breaks Screener //version = 0 //19.03.24 //Iván González @ www.prorealcode.com //Sharing ProRealTime knowledge //////////////////////////////////////////////////////////////// //------------Inputs-----------------------------------------// prd = 1 //pivot length //------------Bullish and bearish conditions-----------------// isObUp = close[1]<open[1] and close>open and close > high[1] isObDown = close[1]>open[1] and close < open and close < low[1] //------------Pivots low-------------------------------------// if low > low[prd] and lowest[prd](low) > low[prd] and low[prd] < lowest[prd](low)[prd+1] then $pl[z+1] = low[prd] $plx[z+1] = barindex[prd] z = z + 1 endif //------------Pivots high------------------------------------// if high < high[prd] and highest[prd](high)<high[prd] and high[prd]>highest[prd](high)[prd+1] then $ph[t+1]=high[prd] $phx[t+1]=barindex[prd] t=t+1 endif //----------Bearish Signal-----------------------------------// bearishTriangle = isObDown and ((max(high, high[1]) > $ph[t] and close < $ph[t]) or (max(high, high[1]) > $ph[t][1] and close < $ph[t][1])) //----------Bullish Signal-----------------------------------// bullishTriangle = isObUp and ((min(low, low[1]) < $pl[z] and close > $pl[z]) or (min(low, low[1]) < $pl[z][1] and close > $pl[z][1])) //----------Screener condition-------------------------------// screener[bearishTriangle or bullishTriangle] |
Share this
No information on this site is investment advice or a solicitation to buy or sell any financial instrument. Past performance is not indicative of future results. Trading may expose you to risk of loss greater than your deposits and is only suitable for experienced investors who have sufficient financial means to bear such risk.
ProRealTime ITF files and other attachments :
Find other exclusive trading pro-tools on ![]()
PRC is also on YouTube, subscribe to our channel for exclusive content and tutorials


Thank you!