

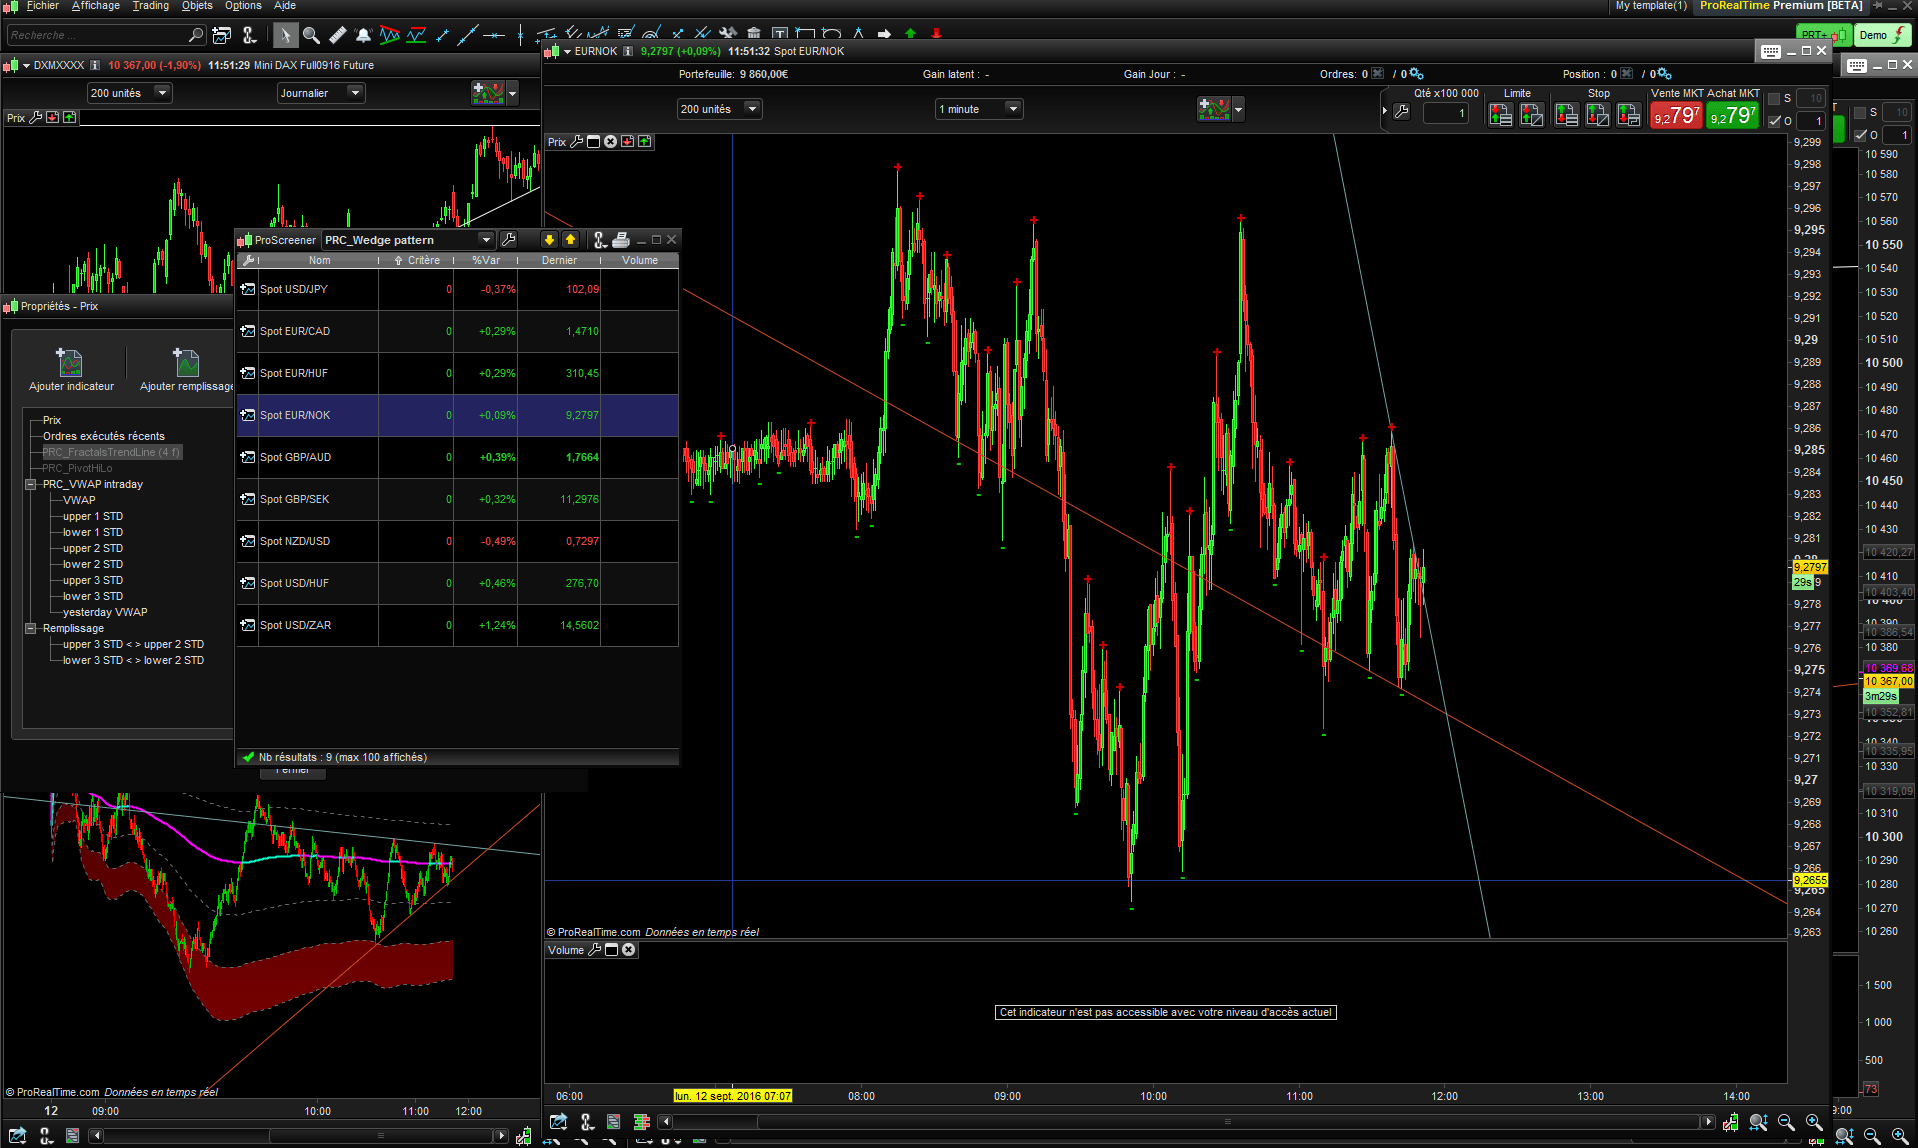
Wedge pattern screener
This screener can detect wedge patterns : rising, falling and symmetrical ones. The wedge is drawn with the last fractals detected on charts (lookback = 10 periods in the past).
The rising wedge is a bearish reversal pattern formed by two converging upward slants. To confirm a rising wedge, there must have oscillation between the two lines. Each line must be touched at least twice for validation.
This pattern marks the shortness of buyers. This one is characterized by a progressive reduction of the amplitude of the waves. The lowest reaches during the first correction on the resistance of the wedge will form the support. A second wave of increase will then occur, but with lower amplitude, which make appear the weakness of buyers. A second wave is formed thereafter but prices will increase less and less at the contact with the support. Volumes are then at their lowest and gradually decrease as the waves. The movement then has almost no buying power which indicates the willingness of a bearish reversal.
The target price is given by the lowest point that resulted in the formation of the wedge.
The falling wedge is a bullish reversal pattern formed by two converging downward slants. To confirm a falling wedge, there must have oscillation between the two lines. Each line must be touched at least twice for validation.
This pattern marks the shortness of sellers. This one is characterized by a progressive reduction of the amplitude of the waves. The highest reaches during the first correction on the support of the wedge will form the resistance. A second wave of decrease will then occur, but with lower amplitude, which make appear the weakness of sellers. A second wave is formed thereafter but prices will decrease less and less at the contact with the resistance. Volumes are then at their lowest and gradually decrease as the waves. The movement then has almost no selling power which indicates the willingness of a bullish reversal.
The target price is given by the highest point that resulted in the formation of the wedge.
(explanation from : http://www.forex-tribe.com/)
//PRC_Wedge pattern | screener
//12.09.2016
//Nicolas @ www.prorealcode.com
//Sharing ProRealTime knowledge

//fractals
cp = 10 //lookback

if high[cp] >= highest[(cp)*2+1](high) then
 LLH = 1
else
 LLH = 0
endif

if low[cp] <= lowest[(cp)*2+1](low)  then
 LLL = -1
else
 LLL = 0
endif

if LLH = 1 then
 a = b[1]
 abar = bbar[1]
 b = high[cp]
 bbar = barindex[cp]
endif

if LLL = -1 then
 c = d[1]
 cbar = dbar[1]
 d = low[cp]
 dbar = barindex[cp]
endif

c1 = a<b and c<d and abs(abar-bbar)>abs(cbar-dbar) and abs(a-b)<abs(c-d)
c2 = a>b and c<d
c3 = a>b and c>d and abs(abar-bbar)<abs(cbar-dbar) and abs(a-b)>abs(c-d)

SCREENER [c1 or c2 or c3]