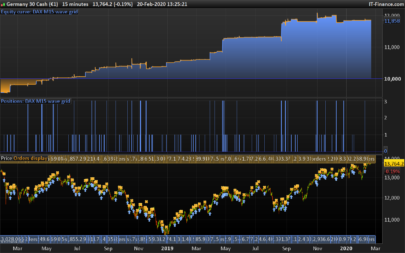
Simple trading strategy also made with the help of the signals given by the super smoother filter indicator, this time in intraday, on 15 minutes timeframe. Previous strategy made with this indicator is located here: http://www.prorealcode.com/prorealtime-trading-strategies/bund-cfd-strategy-4/
Test were made with mini CFD contracts, 1 point spread.
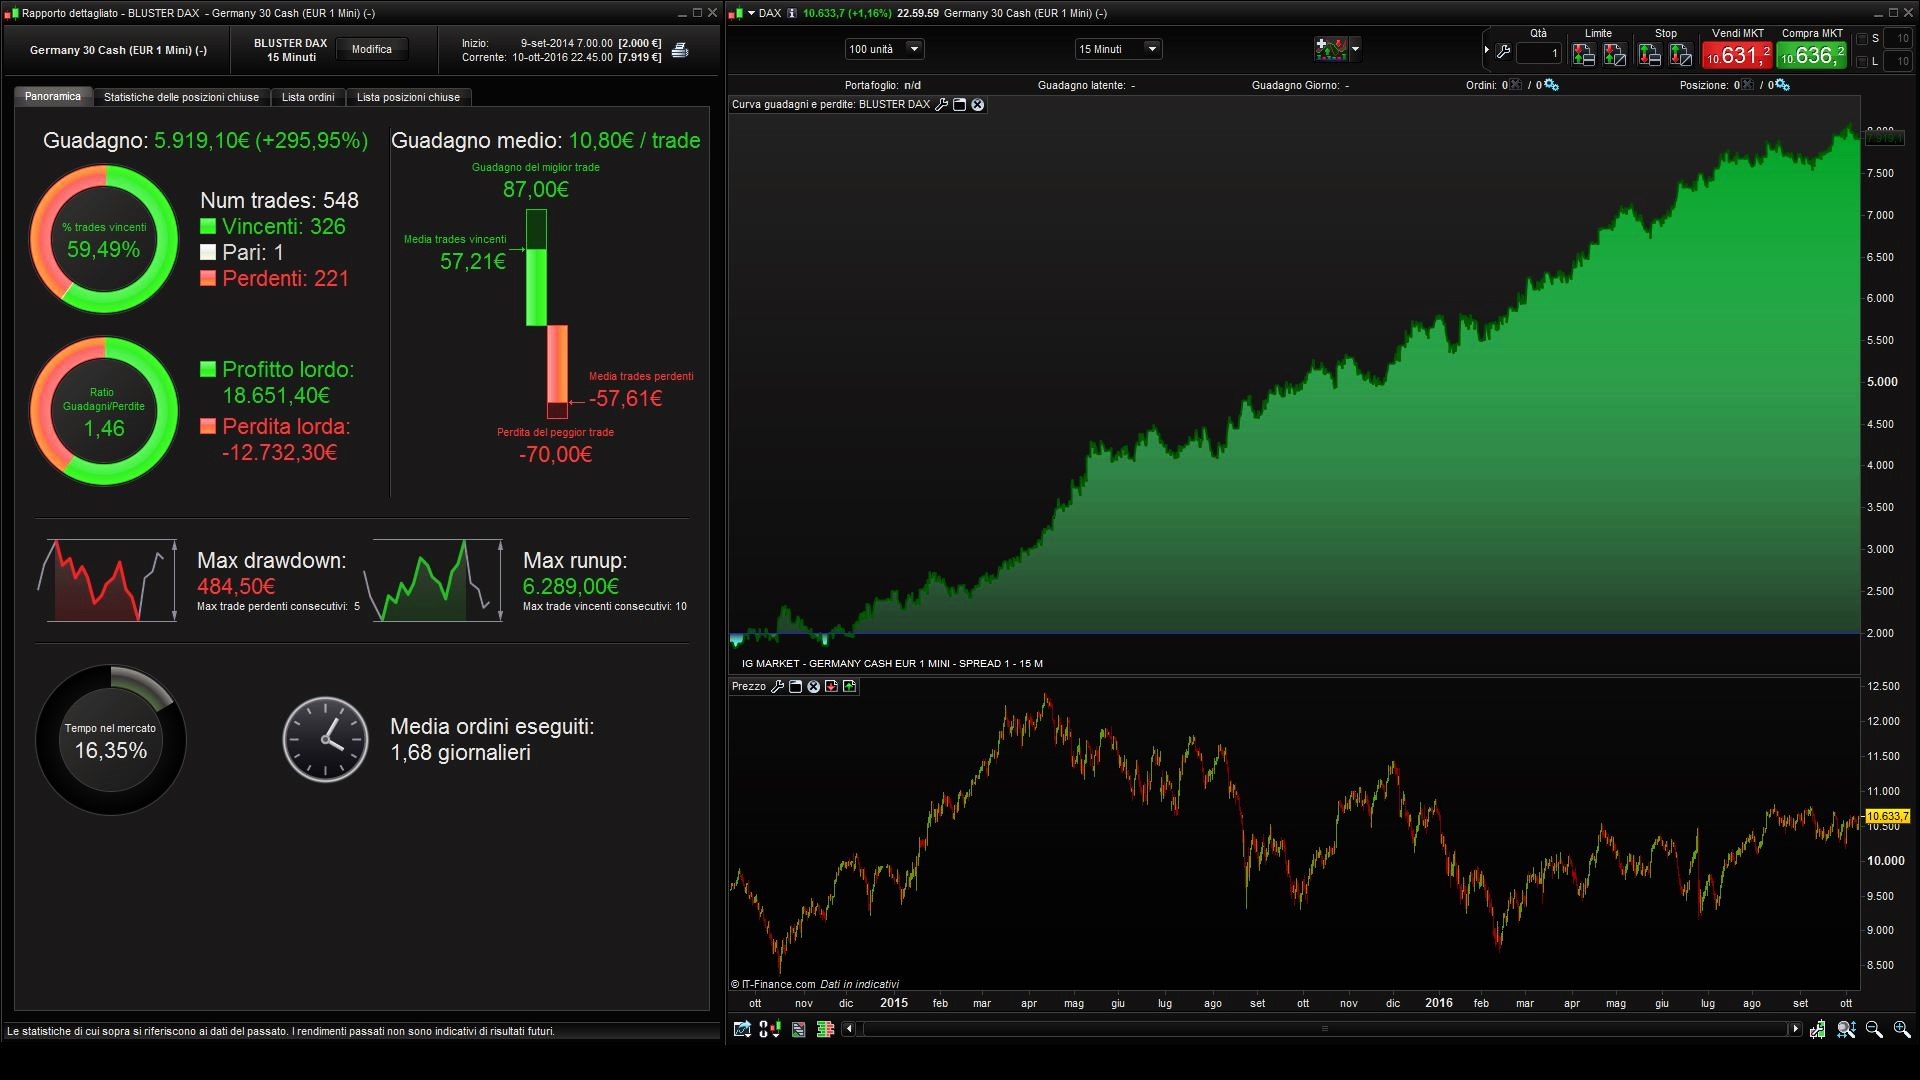
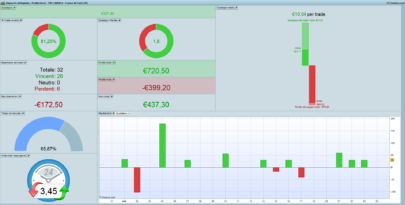
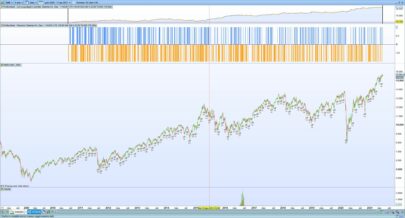
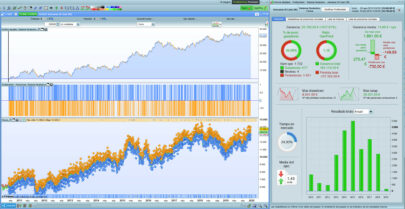
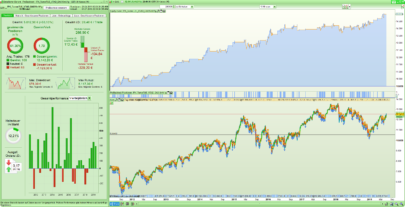
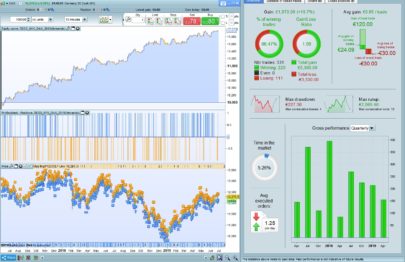
The strategy trade long and short positions, but long positions are much more triggered.
|
1 2 3 4 5 6 7 8 9 10 11 12 13 14 15 16 17 18 19 20 21 22 23 24 25 26 27 28 29 30 31 32 33 34 35 36 37 38 39 40 41 42 43 44 45 46 47 48 49 50 51 52 53 54 55 56 57 58 59 60 61 62 63 64 65 66 67 68 69 |
// THIS SIMPLE STRATEGY CATCH PROFIT BY UNIVERSAL INDICATOR // IG MARKET GERMANY CASH 1 EUR MINI - SPREAD 1 - 15 M DEFPARAM CumulateOrders = FALSE DEFPARAM FlatBefore = 080000 DEFPARAM FlatAfter = 212900 if (time >=080000 and time < 110000) or (time >= 134500 and time <181400) then indicator1, ignored = CALL "BLUSTER DAX" c1 = (indicator1 >= 1) IF c1 AND CurrentDayOfWeek <> 1 THEN BUY 1 CONTRACT AT MARKET ENDIF indicator2, ignored = CALL "BLUSTER DAX" c2 = (indicator2 <= -1) IF c2 THEN SELL AT MARKET ENDIF indicator3, ignored = CALL "BLUSTER DAX" c3 = (indicator3 <= -1) IF c3 AND CurrentDayOfWeek <> 1 THEN SELLSHORT 1 CONTRACT AT MARKET ENDIF indicator4, ignored = CALL "BLUSTER DAX" c4 = (indicator4 >= 1) IF c4 THEN EXITSHORT AT MARKET ENDIF // TRAILING STOP LOGIK BY KENNETH KVISTAD MODIFIED FOR LONG AND SHORT POSITION TGL =47 TGS= 41 if not onmarket then MAXPRICE = 0 MINPRICE = close PREZZOUSCITA = 0 ENDIF if longonmarket then MAXPRICE = MAX(MAXPRICE,close) if MAXPRICE-tradeprice(1)>=TGL*pointsize then PREZZOUSCITA = MAXPRICE-TGL*pointsize ENDIF ENDIF if shortonmarket then MINPRICE = MIN(MINPRICE,close) if tradeprice(1)-MINPRICE>=TGS*pointsize then PREZZOUSCITA = MINPRICE+TGS*pointsize ENDIF ENDIF if onmarket and PREZZOUSCITA>0 then EXITSHORT AT PREZZOUSCITA STOP SELL AT PREZZOUSCITA STOP ENDIF SET STOP PLOSS 70 SET TARGET PPROFIT 87 ENDIF // REGARDS ALE |
Indicator needed to run the strategy : (“BLUSTER DAX”)
|
1 2 3 4 5 6 7 8 9 10 11 12 13 14 15 16 17 18 19 20 21 22 23 24 25 26 27 28 29 30 31 32 33 34 35 36 37 38 |
//------------------------------------------------------------------------- // UNIVERSAL CODE POSTED BY NICOLAS // SET TO RUN BLUSTER DAX STRATEGY //------------------------------------------------------------------------- bandedge=40 whitenoise= (Close - Close[1]) if barindex>bandedge then // super smoother filter a1= Exp(-1.414 * 3.14159 / bandedge) b1= 2*a1 * Cos(1.414*180 /bandedge) c2= b1 c3= -a1 * a1 c1= 1 - c2 - c3 filt= c1 * (whitenoise + whitenoise[1])/2+ c2*filt[1] + c3*filt[1] filt1 = filt if ABS(filt1)>pk[1] then pk = ABS(filt1) else pk = 0.99* pk[1] endif if pk=0 then denom = -1 else denom = pk endif if denom = -1 then result = result[1] else result = filt1/pk endif endif RETURN result COLOURED(66,66,255) as "PRICE ACTION", 0 as "0" |
Share this
No information on this site is investment advice or a solicitation to buy or sell any financial instrument. Past performance is not indicative of future results. Trading may expose you to risk of loss greater than your deposits and is only suitable for experienced investors who have sufficient financial means to bear such risk.
ProRealTime ITF files and other attachments :PRC is also on YouTube, subscribe to our channel for exclusive content and tutorials

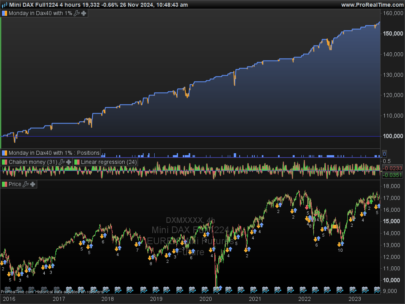
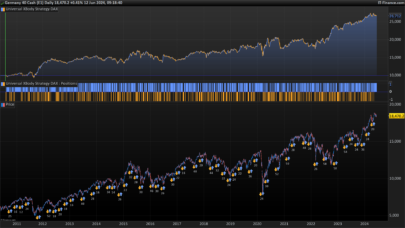
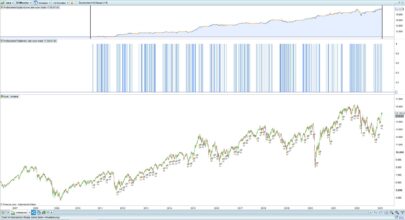
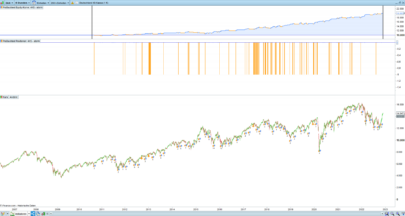


Thank you ALE for this new contribution. Here are my thoughts about this strategy (please don’t be offended):
1/ about the code, you don’t need to CALL your indicator multiple times, you can call it once and code your conditions within the same variable name. It can work like this, but you consume memory for nothing.
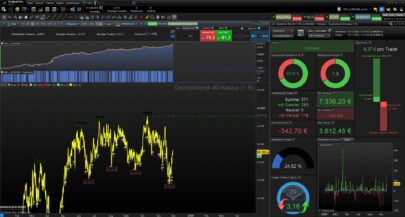
2/ trades symmetry is good (almost same number of long and short positions), but the long positions are much more winning than the short ones, seems to be something to investigate why?
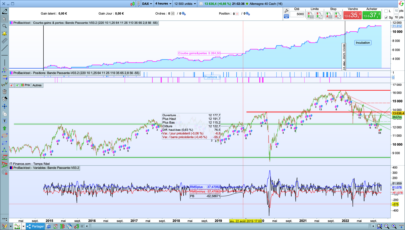
3/ the strategy result is not so good before 2013, so I guess you have optimised the values a bit starting from 2013 to now?
1/ 🙂 Yes could be optimized off course, but there is not difference to execute orders2/ The market moves down quickly than when it rises, the bounces are different. When the market goes down the trailing stop can be more small and trap more winning positions.3/ The Germany cash CFD of IG markets close at 23.00 or 22.45 on friday, the historical data start from 10 settembre 2014. Do you have different Historical data on IG market?Thanks
3/ I’m with PRT_CFD with more much more history
I hope that someone could optimized strategy in 4 h to have more profits and more historical data. In my opinion this strategy is not bad, but It must optimized in the Ratio Gain/loss and percentage of wins. Obviusly the strategy is very Basic.
@Nicolas 2/ The more winning trade are short
Thank you for your contribution.
I agree that 4 calls to the same function with no change in variables is not optimum for code execution
2. I dont understand why the function called return always 0 as second result even if the returned value is ignored
3. How are defined the pLoss and Pprofit values , by strategy optimization with ProRealTime Simulation ?
Pierre
HELLO
3. observing the positions, and testing very times the strategy.
HI PierreI don’t understand your third comment.Thanks
Cio ALE,
How did you get those 2 values ?
Pierre
Ciao ALE,
Thanks for your good job !!
Grazie Ernesto, prima o poi troveremo delle strategie imbattibili!!
Hello all
Thanks for this strategy ALE.
Small question, if the strats works between 8am and 21h29 , why do you use a spread of 1 ?
By IG, spread is 2 between 8 and 9am and after 17h30
Reb
Hello Reb,
You’re right, it’s just a approximation.
You can consider 1.5 to spread but you must also consider that the slippage factor often measuring 2/3 Also points.
Thanks
Thanks for this strategy ALE. good job.
hello
is this tested in tick mode?
Hello Abz
it’s not in Tick mode.
This strategy must be improved, it’s an idea only!
Ciao Ale,
ho provato ad eseguire il test usando la piattaforma t3 di webank ma mi da una serie di errori. E’ possibile apportare qualche modifica?
Grazie.
Ciao
certo ! come posso aiutarti?
Allora il primo errore me lo da su cumulate orders
Errore di sintassiLinea3, Colonna10Una delle espressioni seguenti sarebbe più appropriata di”CumulateOrders”:“,”“=”
Allora il primo errore me lo da su cumulate orders
Errore di sintassiLinea3, Colonna10Una delle espressioni seguenti sarebbe più appropriata di”CumulateOrders”:“,”“=”
Se metto “=” mi fa andare avanti e mi porta altro errore:
if MAXPRICE-tradeprice(1)>=TGL*pointsize then (l’errore che mi riporta è Errore di sintassiLinea46, Colonna26Una delle espressioni seguenti sarebbe più appropriata di”(“:“[““=”“+”“-““*”“/”“mod”“<““>”“<>”“or”“and”“xor”“then”
Ciao
È strano hai provato ad aprire una nuova creazione di Trading sistem e reincollare il codice?
Ciao Ale, si ho provato più volte ma niente. E’ chiaro che ho inserito l’indicatore da te creato già nella lista degli indicatori. Però proprio il codice mi da problemi.
Visto che tu con i codici sei un drago, per caso sai se esiste qualcosa sul volume profile da far girare sulla piattaforma T3?
Davvero grazie Ale per le risposte.
ahaaha, un Drago non direi.. sono un appassionato.. quello si!!Il Market Profile è una delle strategie più interessanti da automatizzare, ma non me ne sono più interessato. Chiedo a Nicolas
Hai provato a scaricare i file .itf qui sopra e richiamarli con la piattaforma?
Il bello è che la piattaforma non mi fa richiamare i file. T3 è molto diversa da prorealtime, anche se sembrano la stessa cosa. La versione di T3 sta molto indietro a quanto pare.
Quello che ti chiedevo è il volume profile, molto diverso dal market profile. Infatti il volume profile calcola su quali livelli sono concentrati i maggiori volumi a differenza del market che calcola quali sono i livelli più scambiati.
Grazie 😉
Intendevo dire la strategia basata sul market profile + volme profile
L’indicatore plotta il volume profile sul grafico con delle barre laterali. Su PRT versione end of day mi pare esista già. NOn ho abbonamento e quindi non posso testarla su time frame più bassi. Magari si riuscisse ad avere codice 😉
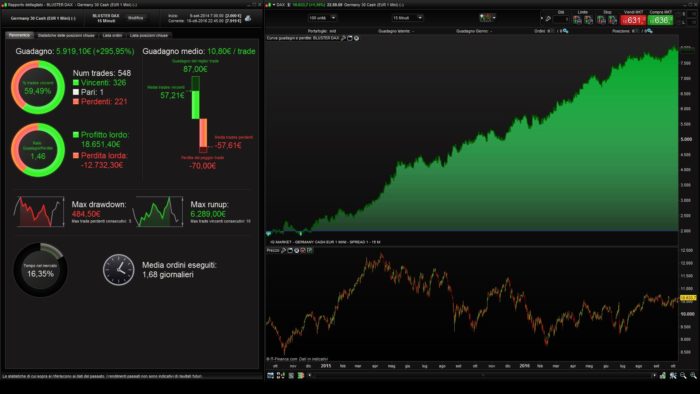
CIAO aLE, GRAZIE PER AVER CONDIVISO, VOLEVO SAPERE COME MAI NON MI TROVO CON I RISULTATI CHE SONO NELL IMMAGINE , IO MI TROVO UN 27% DI GAIN DALL 8 OTT 2014 AL 7 NOV 2016, dAX tf 15 MIN 1 P SPREAD (ANCHE SE NON è CFD ,NON CREDO CI SIA TUTTA QUESTA DIFFERENZA CON IL 295% CHE VEDO NELLA FOTO)
GRAZIE
Ciao Enzo,
No purtroppo c’è una grossa differenza, i CFD hanno delle quotazioni specifiche, è per questo motivo che nelle strategie pubblicate che trovi su questo sito, è indicato il codice dell’asset.DAX tf cos’è?PS: Scrivi in inglese cosi tutti possono comprendere domanda e risposta, grazie
Grazie Ale, ma sai dirmi quali parametri cambiare per avere la.stessa equity anche sul mini cash?
Grazie
Vincenzo
Thanks Ale, TF is time frame ,
So, can you tell me the set -up for to have the same results on mini Dax cash?
Thanks
Vincenzo
ps: I’m not using this strategy on real account because It must be optimized.
Ciao Enzo,
non ho ben capito quale strumento stai utilizzando. Mi copieresti il nome di IG su PRT?
Grazie
AlePS: io non la sto usando in reale, perche vorrei modificarla, mentre sono in reale su qu_dax1h
Hi Ale, german 30 cash mini 1E ,
Thanks a lot
I don’t know why do you have different result, may be that the picture is hold.
Variables to set:
-StrategyWindow time tradingTgl/Tgs
Stop & Profit
-IndicatorBandedgeWhitenoise
Hi Ale, german 30 mini 1E
Thanks
Hi Ale, so you have the same results with german 30 mini 1e cash TF 1h?
no, only with TF 15m
Grazie tante, Thanks so much
Hallo Ale,
First of all, thank you for this strategy.
Could you explain what the BLUSTER DAX indicator is doing, what it is meant to do ?
I tested this strategy on the 15 min DAX, it gave me only whipsaw results, to almost zero profit, so I vary with the timeframes: 2-hour bars works with me.
I used a pip spread of 1.7 and did not use the trailing stop loss you use (does it work, not with me). See the code of your strategy I have used, included the indicator below.
It seems to work quite well with me for the 2 hours bars, however not that much result, but quite stable results, OOS results bit too good
IS 66% 8 jan 2014 -16 nov 2016 920 Euro
OOS 34% 17 nov – 10 may 2018 1.033 Euro
193 trades
55% winning, and ONLY 5;35 % IN THE MARKET with a position, during the day, which gives a very comfortable risk profile !
Appendix: your strategy as I tested it in PRT
//=================================================================================
// THIS SIMPLE STRATEGY CATCH PROFIT BY UNIVERSAL INDICATOR
// IG MARKET GERMANY CASH 1 EUR MINI – SPREAD 1,7 – 15 Min
DEFPARAM CumulateOrders = FALSE
DEFPARAM FlatBefore = 080000
DEFPARAM FlatAfter = 212900
//DEFPARAM PRELOADBARS = 500 default is 200, is sufficient to let it work
//===========================================
//————————————————————————-
// UNIVERSAL CODE POSTED BY NICOLAS
// SET TO RUN BLUSTER DAX STRATEGY
//————————————————————————-
bandedge= 40 //default is 40, optimise with variable does not work ?
whitenoise= (Close – Close[1])
if barindex>bandedge then //is this condition needed, as barindex is always > 40 ?
// super smoother filter
a1= Exp(-1.414 * 3.14159 / bandedge)
b1= 2*a1 * Cos(1.414*180 /bandedge)
c2= b1
c3= -a1 * a1
c1= 1 – c2 – c3
filt= c1 * (whitenoise + whitenoise[1])/2+ c2*filt[1] + c3*filt[1]
filt1 = filt
if ABS(filt1)>pk[1] then
pk = ABS(filt1)
else
pk = 0.99* pk[1]
endif
if pk=0 then
denom = -1
else
denom = pk
endif
if denom = -1 then
result = result[1]
else
result = filt1/pk
endif
endif
//Graph result COLOURED(66,66,255) as “PRICE ACTION”, 0 as “0”
//=============================================================
N = 1
If (time >=080000 and time = 134500 and time =1 AND CurrentDayOfWeek 1 THEN
BUY N CONTRACT AT MARKET // will also close short position
ENDIF
IF result <= -1 AND CurrentDayOfWeek 1 THEN
SELLSHORT N CONTRACT AT MARKET // will also close long position
ENDIF
SET STOP PLOSS 70
SET TARGET PPROFIT 87
ENDIF
// REGARDS ALE