EUR / USD 1 minute strategy
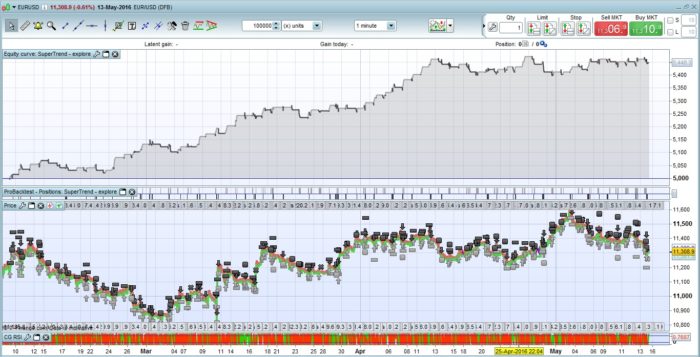
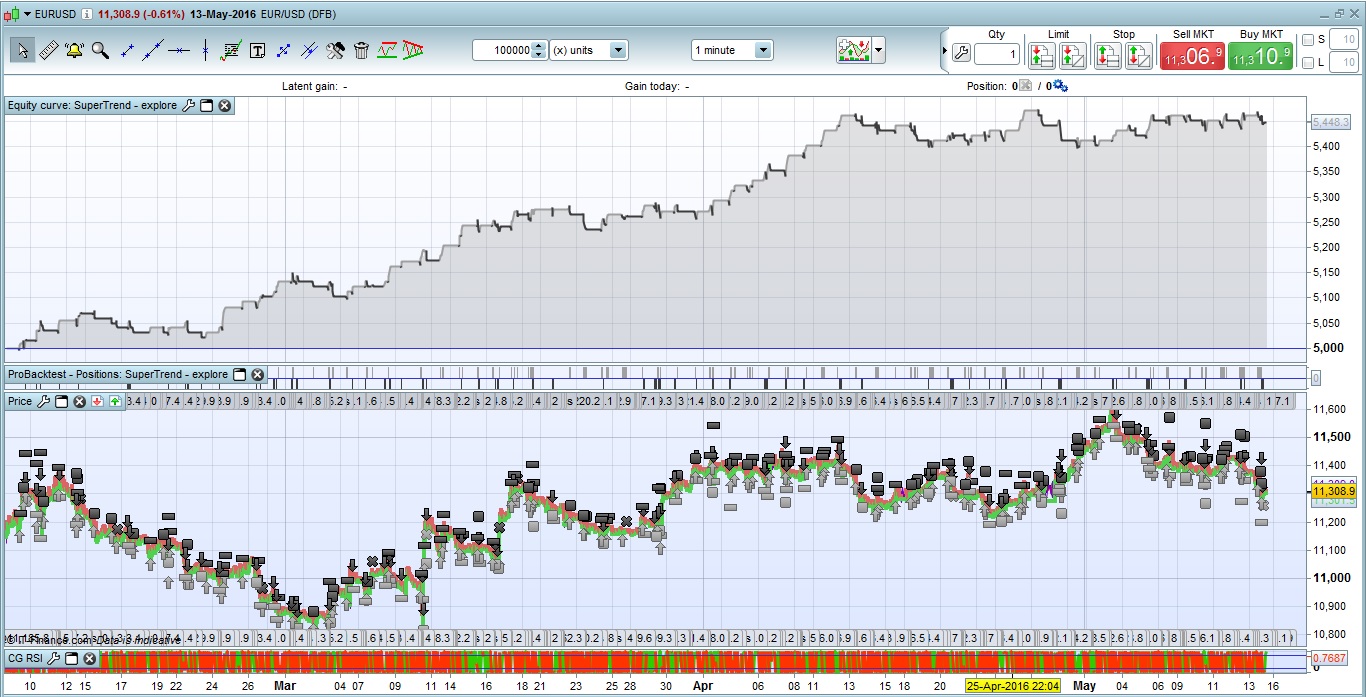
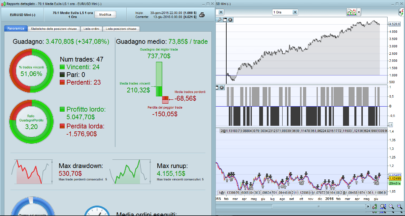
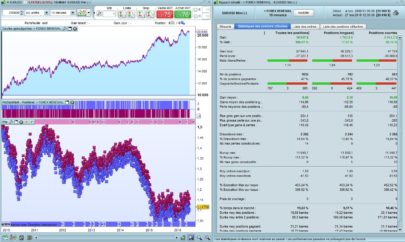
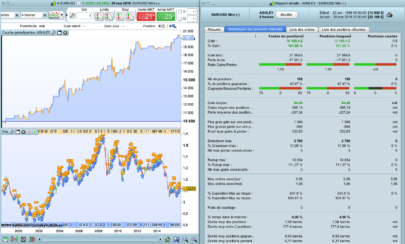
This strategy is a combination of 3 indicators, SuperTrend, Parabolic SAR and MACD; also including the Range. A trade entry is generated following the switch of the Parabolic SAR from BUY to SELL or vice versa, after a longer Parabolic SAR run (the aim of this is to ignore shorter term price changes and focus on more significant trend changes). The attachments and performance is based on only £1 per pip, producing an approximate 9% return every 3 months. Compounding the trade size as your capital grows should produce a reasonable return (i.e. use the 2% compounding model as per Bob Volman’s book (2011) on FX scalping.
However this is far from perfect as I would like to improve the Win / Loss ratio. So any comments and improvements are welcome!
|
1 2 3 4 5 6 7 8 9 10 11 12 13 14 15 16 17 18 19 20 21 22 23 24 25 26 27 28 29 30 31 32 33 34 35 36 37 38 39 40 41 42 43 44 45 46 47 48 |
// Definition of code parameters DEFPARAM CumulateOrders = False // Cumulating positions deactivated DEFPARAM FlatBefore = 080000 DEFPARAM FlatAfter = 180000 ST = SuperTrend[3,5] //3,10 ParaSAR = SAR[0.02,0.02,0.03] MCD = MACDline[12,26,150](close) SIG = ExponentialAverage[9](MACDline[12,26,150](close)) Q = MCD - SIG a=Range p = 100 //100 a1= lowest[p](low) //p b1= highest[p](high) //p c1 =100* (3 * close - 2* a1 - open[p-1]) / customclose //p-1 c2 = 100*(open[p-1] + 2 * b1 -3 * close) / customclose //p-1 SR = exponentialAverage[p*5](c1) - exponentialAverage[p*5](c2) //5*p ONCE countB = 0 ONCE countS = 0 IF ST[2] >= ST[1] THEN countB = countB + 1 ELSE countB = 0 ENDIF IF ST[1] >= ST[2] THEN countS = countS + 1 ELSE countS = 0 ENDIF // Conditions to enter long positions 0.045 IF NOT ONMARKET AND countB > 15 AND ST > ST[1] AND ParaSAR < close AND (Q - Q[1]) > (0.045*POINTSIZE) AND SR > SR[1] AND a[1] > 2*PIPSIZE THEN BUY 1 PERPOINT AT MARKET ENDIF // Conditions to enter short positions 0.19 0.186 IF NOT ONMARKET AND countS > 15 AND ST[1] > ST AND ParaSAR > close AND (Q[1] - Q) > (0.186*POINTSIZE) AND SR < SR[1] AND a[1] > 2*PIPSIZE THEN SELLSHORT 1 PERPOINT AT MARKET ENDIF // Stops and targets SET TARGET pPROFIT 10 SET STOP PLOSS 10 |
Share this
No information on this site is investment advice or a solicitation to buy or sell any financial instrument. Past performance is not indicative of future results. Trading may expose you to risk of loss greater than your deposits and is only suitable for experienced investors who have sufficient financial means to bear such risk.
ProRealTime ITF files and other attachments :PRC is also on YouTube, subscribe to our channel for exclusive content and tutorials

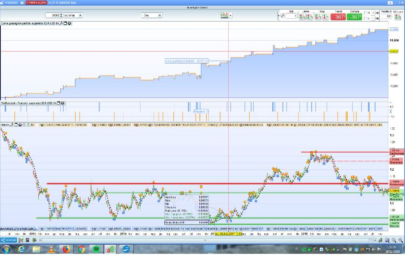
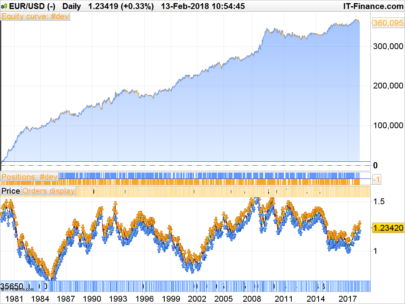
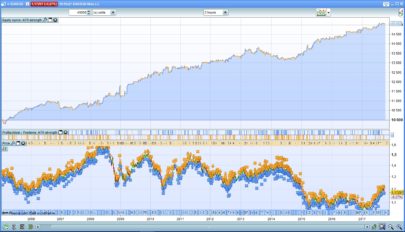
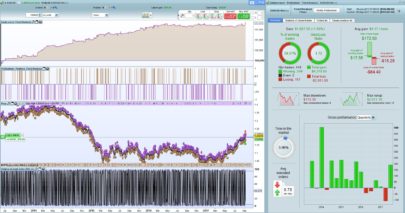
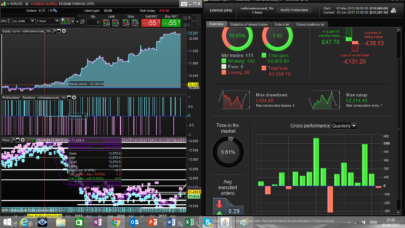
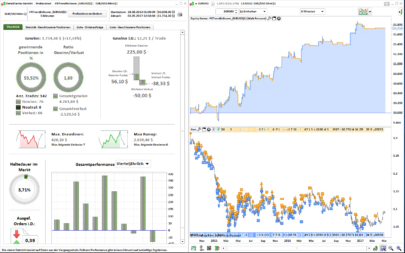
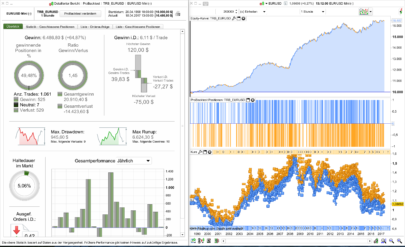
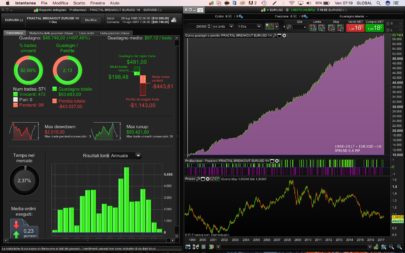
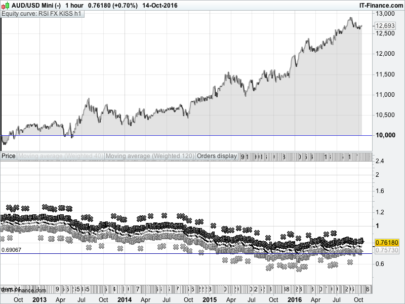
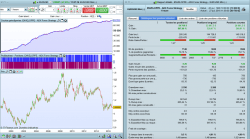
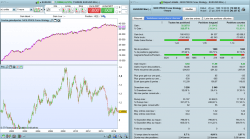
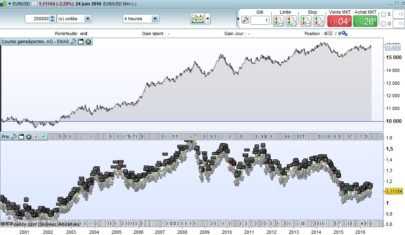
Thanks a lot for your contribution to the library. Much appreciated 😉
Nicolas, cette stratégie ne fonctionne pas avec l’EUR/USD minilot en France et je ne comprends pas le a[1]>2. Pourrais-tu m’expliquer ou traduire cette stratégie sur le minilot EUR/USD français.
Bien cordialement,
hello! this program when I download, no run. I don’t know why.
not working too hard for me to find the error..
I just asked the author of this strategy, cpgraham, the reason why no trade are launched.
I think the lines 36 and 41 maybe have something wrong in the range tests and the a[1]>2 should be replaced by :
a[1] > 2*pipsize
But this is not my code and I’m looking forward for cpgraham answers 🙂
Its probably the difference between IGs CFD and SB quotes?
EURUSD SB = 11 325.1
EURUSD CFD = 1.13251
Hi all, thanks for the feedback. I apologise for any difficulties running the code. I suspect the problems are a combination of a few issues; hence some further details are appropriate. My setup is: IG Markets version 10.2 of ProRealTime.
Eric is absolutely correct. There can be differences in quote formats with brokers. Most brokers quote in the same format as normal FX quotes e.g. 1.1325; but IG have moved the decimal point 4 places to 11325.1. After a little checking using POINTSIZE to convert the price into the correct format should resolve the issue. I also tested the change suggested by Nicolas on my version, and it produced the same results, so hopefully these fixes should work on any version / platform of PRT. The amended code is attached below. If you are still having problems you know the likely reasons why, as stated here, so you should be able to resolve them. If not please let me know and I’ll do my best to help you resolve it. Hopefully you can step through the code and understand what the strategy is doing, and apply it to your platform.
// Definition of code parameters
DEFPARAM CumulateOrders = False // Cumulating positions deactivated
DEFPARAM FlatBefore = 080000
DEFPARAM FlatAfter = 180000
ST = SuperTrend[3,5] //3,10
ParaSAR = SAR[0.02,0.02,0.03]
MCD = MACDline[12,26,150](close)
SIG = ExponentialAverage[9](MACDline[12,26,150](close))
Q = MCD - SIG
a=Range
p = 100 //100
a1= lowest[p](low) //p
b1= highest[p](high) //p
c1 =100* (3 * close - 2* a1 - open[p-1]) / customclose //p-1
c2 = 100*(open[p-1] + 2 * b1 -3 * close) / customclose //p-1
SR = exponentialAverage[p*5](c1) - exponentialAverage[p*5](c2) //5*p
ONCE countB = 0
ONCE countS = 0
IF ST[2] >= ST[1] THEN
countB = countB + 1
ELSE
countB = 0
ENDIF
IF ST[1] >= ST[2] THEN
countS = countS + 1
ELSE
countS = 0
ENDIF
// Conditions to enter long positions 0.045
IF NOT ONMARKET AND countB > 15 AND ST > ST[1] AND ParaSAR < close AND (Q - Q[1]) > (0.045*POINTSIZE) AND SR > SR[1] AND a[1] > 2*PIPSIZE THEN
BUY 1 PERPOINT AT MARKET
ENDIF
// Conditions to enter short positions 0.19 0.186
IF NOT ONMARKET AND countS > 15 AND ST[1] > ST AND ParaSAR > close AND (Q[1] - Q) > (0.186*POINTSIZE) AND SR < SR[1] AND a[1] > 2*PIPSIZE THEN
SELLSHORT 1 PERPOINT AT MARKET
ENDIF
// Stops and targets
SET TARGET pPROFIT 10
SET STOP PLOSS 10
ça marche pas ….
je suis d accord avec eric , doit y avoir un soucis avec l echelle .
ok it works !
Good. Enjoy. Please advise of any improvements. Many thanks.
works well on dax 10 min 15 min …. but spread non included .
IG Market spread on EUR / USD is 0.8 pip
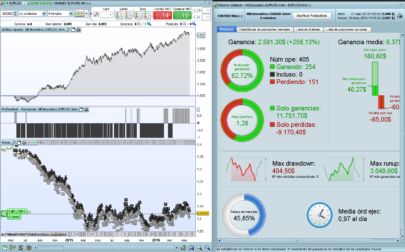
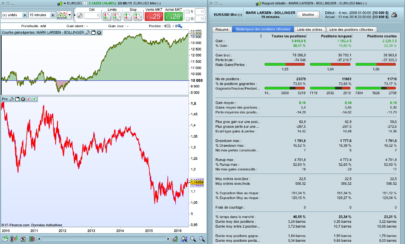
i ‘ ll try to post some screenshots …
Thanks ladefense; I agree, both 10 min and 15 min on the DAX works well!
Hi guys. I tried testing this same code and agree that on the face of it the Dax 10/15m appears to work well but on closer inspection at the timing of the entry/exits the results cannot be relied upon. A large proportion of the trades are entered and exited within the same bar (admittedly resulting in both profits and losses) but as has been discussed on here before, this gives rise to incorrect results as it is a limitation of PRT that the system cannot look inside the bar to see how the ticks actually progressed in real time. So I would view any results like these with caution. Perhaps there may be a way of coding the indicators to use 10/15 min periods (ie 2/3 x 5 min bars) but the code is always run on a 5 min timeframe to give more accurate results ? I’m trying myself to code like this but am finding it difficult so far.
On a more positive note it works well on EUR/USD 1 min with none of the issues above, so something worth pursuing on that front I think. I am going to test some parameters and will report back if anything useful comes out of it.
Hi,
what is the correct code and in wich market perform the best ? I will try to optimize it. Tanks emanuele
The code of the post has been updated to the final version FYI.
I think that with some optimization, it can be a good strategy.For example :
DAX, M15
spread : 1 point
stop loss and take profit : 30 pips (to avoid SL and TP on the same candle, which PRT considers always as a winning trade…)
We need to make some tests
When are PRT going to sort this issue that makes Backtest using StopLoss / Trailing StopLoss worse than useless because it misleads users into false hope / results!?
I wrote this on another PRT Group a few weeks ago, I may as well reproduce here for information / comment …
PRT Backtest can give very much false results when Trailing Stop or Stop Loss (TS or SL) points / $ are included in the strategy. About 12 months ago, I sent many emails to PRT; I got the impression they didn’t seem to comprehend why backtest is useless with respect to TS or SL! I suggested they get a developer who also has a Trader mindset to look at the problem. I suggested PRT use tick data (PRT has all tick data within every bar) or even that TS and SL are checked every 1 second (regardless of Timeframe) rather than at the end of a bar … NOTE: TS and SL check would be once per day on BackTest if using Daily Timeframe … how useless that is … we could all be millionaires if Live results were remotely like backtest results re TS and SL.
Note: During Live Trading, that same Strategy using Daily Bars would be checking for for your TS and SL settings at every tick (not once per day as on BackTest) so you see why Backtest results can be very much false with respect to TS and SL when compared to Live Trading.
In my more naive days using PRT and when I first started coding strategies (just over 12 months ago) I thought ‘I’d made it’ as I coded a Strategy which made me £139K in a few months on BackTest! Only to find when I went Live with the Strategy … each and every Trade got kicked out / exited within the first few seconds / minutes at a loss! Reason – Backtest was checking my Stop Loss every 1 hour bar and Live Trade checked my Stop Loss at every Tick (as expected)!
What alerted me to this ‘TS and SL backtest nonsense’ was that despite a + £139K Equity Curve there were never any / very few Positions shown in the Backtest results … Reason: Backtest checks at the end of the bar, asks if there has been a 10 point drop at any time during the whole Daily Bar (if stop loss setting is 10 points), answer Yes, Exit Trade / Bar and so no bar / position shows up at all in BackTest results. Next Bar open, cycle repeat … etc. But the daft thing is the profit made during that Daily Bar adds onto the Equity Curve despite there being no bar!!
Hope above makes sense and is useful to those who are perplexed by difference in results between Backtest and Live Trading with respect to TS and SL
I can’t believe PRT havn’t sorted this yet!? I will send above to PRT after it’s been on here for a while. So please comment if what I have said is unclear / misleading and then I can get the version I send to PRT to be more efffective and hopefully kick them into corrective action??
Thanks
GraHal
P.S I don’t think I’ll ever be great at coding up my own original Strategies, but this Site / Forum makes it possible to be successful anyway thanks to all the helpful members on here.
A big thanks to Nicolas for making it all possible for us and also for being so active in the Forum himself.
Does anybody could backtest the strategie on forex ( eur usd ) with more data ?
i mean before february 2016 .
Hi Grahal – I fully concur with your comments. Until PRT change the issue with the incorrectly calculated results in backtest anyone using shorter timeframe entry/exit strategies or strategies with very small limits/stops should be very wary of the results as they will almost certainly be incorrect. There almost needs to be a warning on the results incorporated by PRT for this as it will catch out the inexperienced and may cause them ultimate loss.
On the other hand, longer timeframe strategies and those with bigger limits/stops should be accurate as it would most likely not give rise to a “look inside bar” issue. PRT is a very good system on the whole I feel so this should not discourage anyone. This forum is great and many thanks to all the people who take the time to post on here and especially to Nicolas who does a great job on helping everyone.
Also Grahal – thanks for pointing out the zero bar position issue, it’s easy to assume that no position on the graph meant exactly that before but good that you pointed out the possible discrepancy here.
Hi All, I had exactly the same experience a year ago with PRT; I thought I’d discovered a fantastic scalping strategy with a 2 pip stop loss and 2 pip take profit. Running it in live with real funds made me realise otherwise. If I’m being negative about the PRT platform it is that I often find there are differences between the backtests and the real performance; which is frustrating. I suspect the issue is with the broker database of historic data rather than the software itself. That is why I stopped trying to create strategies with anything less than a 6 pip S/L or T/P; because the performance cannot be relied upon.
Ladefense, I’ve also been looking for a source of more historic data for backtesting. I’d be happy to purchase additional data if it was available.
Any improvements to the original code are very welcome, please share them of course.
Best Regards
Hello everyone, I must agree with everyone about the backtests difference with the real time trading.
But, this is something I can ensure everyone, that is definitely a priority for the PRT programmers in their TO-DO list. I can only tell you that this improvement is actually been coded and tested for Probacktest to better reflect real-time trading and what would really occurred. So please be patient because this feature will be implemented with many others… The only information I have about their releases is “when it’s done”, so please don’t ask! 😉
Ah great … thank you Nicolas for the update.
PRT Version 10.3 – due out shortly – has loads of great improvements, but many are ‘nice to have’ rather than essential like this issue with Stop Loss or Take Profit.
Any feature that gives false results on Backtest and in turn leads to lower profits / losses on Live Trades should be worked on by PRT as a matter of priority ahead of ‘nice to haves’.
Who knows how many users try PRT, optimise SLs and TPs and think wow this is great (as I did and @cpgraham) then go Live with the Strategy and lose (maybe lose loads) and then conclude that PRT is a load of rubbish and move onto another platform!?
I nearly ‘binned PRT’ but by then I had invested a lot of time getting up to speed with coding (having never done any coding previously) and so I set to and investigated what exactly was going on.
As you can see the PRT issue with Backtest Stops really bugs me … it is even holding me back from trading Live in a lot of Markets!
I do hope PRT read this thread!
GraHal
ok les gars bien sur je suis d accord avec vous , et je connaissait ce probleme . Mais je pense qu il faut comparer le backtest et les signaux dans pro order ,c est a dire en reel , en ce moment je suis en train de faire cette etude .
Apres cette etude on sera surs que ça ne marche pas ou pas .
@ nicolas : peut tu traduire s il t plait …
Directement depuis Google Translate 🙂
Bonjour à tous, je suis d’accord avec tout le monde à propos de la différence de backtests avec le trading en temps réel.Mais, cela est quelque chose que je peux assurer tout le monde, qui est certainement une priorité pour les programmeurs PRT dans leur liste de tâches. Je peux seulement vous dire que cette amélioration est effectivement été codé et testé pour ProBacktest afin de mieux refléter la négociation en temps réel et ce qui est réellement passé. Alors s’il vous plaît soyez patient car cette fonctionnalité sera mise en œuvre avec beaucoup d’autres … La seule information dont je dispose au sujet de leurs rejets est “quand il est fait”, s’il vous plaît donc ne demandez pas!
real orders and orders on backtest seem to be similar .
Why?
DEFPARAM FlatBefore = 080000DEFPARAM FlatAfter = 180000
It is forex should work 24h. Don’t you think so?
Reading some of the above about back testing. The smaller the time frame the more likely that the back testing will be accurate though none of it is that accurate. Yes, it’s only at the end of the candle that the stops/limits are checked. If you have a 50 stop and a 50 limit and neither is hit during the candle, it moves on to the next as you’d expect. If both the limit and loss are hit during the candle then EVEN IF the stop is hit first, as long as your limit is hit your given the limit and the loss ignored. This inflates profits big time. Ideally it should recognise both and return the 1st hit but alternatively they could easily change it so the loss overrides the profit so and profits made would be understated so when you go live you should at least make what the back testing shows. Over longer time periods on backtesting as the price moves more, there’s more chance your limits and stops will be hit delivering only the profit so shorter time periods on backtesting are likely to be more realistic.
At time of writing on back testing with IG trailing stops don’t work at all on many pairs and not certain they work at all and multiple trades don’t work either. Only one trade at a time opens even when copying the code direct from the manual.
🙁
does anyone still use this strategy? Seems like it doesnt work anymore
Hi Francesco78 doesn’t work as in not great results? I was just going to give it another go, I will and let you know.
I’m coming to a conclusion (rightly or wrongly?) that markets generally have changed in the last 12 months? Breakouts don’t seem to work anymore? I used to do well trading breakouts manual, but they so often seem like ‘traps’ now?? 🙂
Works good on the DAX @ 30 Sec TF over 100,000 bars … maybe everything has speeded up by a factor of 2! 🙂