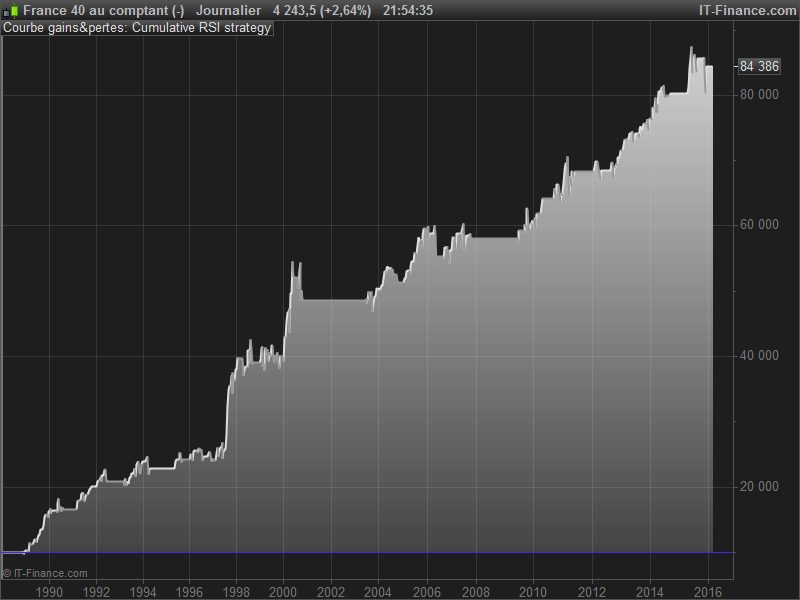
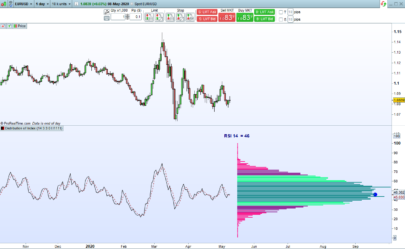
Long only strategy that performs extremely well on any world indices and beyond on a daily timeframe. I will certainly do much exploration of this very short term mean reversion strategy, as it seems very powerful without doing any change on triggers.
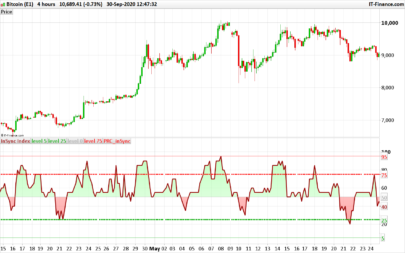
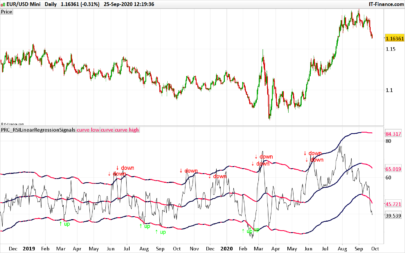
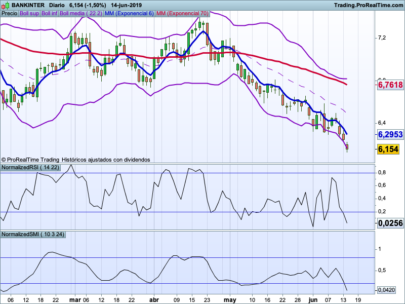
The main trigger is based of a “cumulated RSI” over the 2 recent periods while trade are launch only if the price Close is above a 200 period moving average.
When the cumulated RSI enter in oversold territory, we expect the price to return to its mean, on the bullish trend. We exit the market when the CRSI gain overbought area above the 65 level.
As for my current test : (with exactly the same code on CFDs)
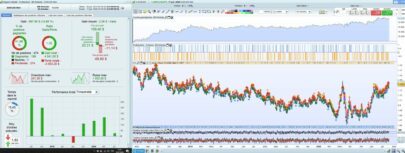
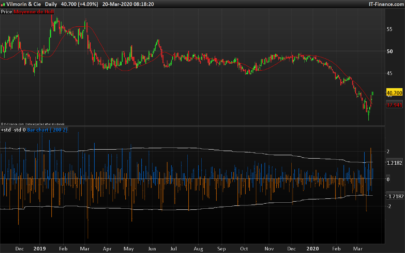
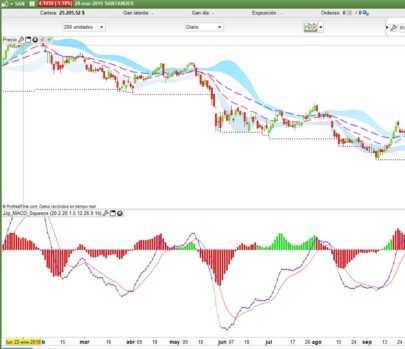
CAC40 : (featuring picture) : 10€ /contracts, 1 contract per trade since 1988 = +370% / % Drawdown max = 12.7%
IBEX35 : 2€ / contract, 1 contract per trade since 1994 = +134.33% / % Drawdown max = 25.6%
SP500 : 1€ / contract, 10 contract per trade since 1984 = +95.33% / % Drawdown max = 8.08%
|
1 2 3 4 5 6 7 8 9 10 11 12 13 14 15 |
//indicator Period = 2 CUMRSI = SUMMATION[Period](RSI[Period](close)) AVG = average[200](close) //initial lot initLOT = 10 IF NOT LongOnMarket AND Close>AVG AND CUMRSI<35 THEN BUY initLOT CONTRACTS AT MARKET ENDIF If LongOnMarket AND CUMRSI>65 THEN SELL AT MARKET ENDIF |
Share this
No information on this site is investment advice or a solicitation to buy or sell any financial instrument. Past performance is not indicative of future results. Trading may expose you to risk of loss greater than your deposits and is only suitable for experienced investors who have sufficient financial means to bear such risk.
ProRealTime ITF files and other attachments :
Find other exclusive trading pro-tools on ![]()
PRC is also on YouTube, subscribe to our channel for exclusive content and tutorials


Very interesting strategy and easy one! Have you tested it in any other markets than your examples??
Not yet. A nice thing to do would be to implement another strategy into this one when price go bearish and dive under the MA200. Of course, it works well because of the mean reverting thing over a nice bullish movement, but adding other strategy over this one would be great, diversification is the key. As i said in this post, i need to work further on it, you are right, it is very interesting!
Bonjour,
Avec une période de 2, la formule “CUMRSI = SUMMATION[Period](RSI[Period](close))\"
équivaut elle bien à
\"CUMRSI = RSI[2](close de la barre courante) + RSI[2](close de la barre précédente)\"?
Cordialement,
FR/ Bonjour f.favret, en effet c’est bien la même chose!
EN/ CUMRSI on 2 period is the same thing as additional of last 2 RSI values :
// example of the same result
r = RSI[2](close)
result = r+r[1]
CUMRSI = SUMMATION[2](r)
RETURN result as \"result\",CUMRSI as \"cumrsi\"
Merci / Thanks!
Why not summation of the 2 lasts RSI 14 period ?of other period?
A lot of quantitative traders believe that the RSI default ’14’ periods is dead, although for what it were developed to : spot the overbought and oversold areas of the price development over time. It does not mean that the RSI formula is mean-less, but not still effective with its default value for whom it were set, back in 1978 by M.Wilder! The cumulative RSI is nothing more than another indicator, it borrows the formula from RSI, cumulate 2 periods and that’s all. Why 2 periods for this one? because price behaviour, return to the mean fastly, no more no less.
Automatic trading and quant strategy development are a vast playground, go on, play with period, create another indicator from this one or a fresh new one, if it works you were right, if not you still have an entire life to learn maths 🙂
Very nice and logical strategy…
Could be used for example to take orders on the french “PEA” (Plan d’Epargne Actions).
“RSI 14” is still alive !
Best regards 😉
“1 contract per trade since 1988 = +370%” – is this per annum, or over the period? How much was your starting capital?
@Stef
Over the whole period. I think that the starting capital tested were 10k€, this is my default value in the ProBacktest.
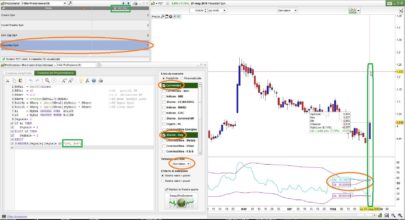
I created the screener of this TradingSystem but it looks like repainting, if today the screener gives me the signal to buy, the next day the TS does not draw anything on the chart.
Maybe because you screen with EOD data? So in this case you are already late.
Hi All! Have you succeeded in developing a strategy also for the bearish side of the market? I tried but without success…
Thanks a lot!
ML
Bonjour .
CAC 40 1988 = 1000 today = 4900 soit 490% en buy and hold ….
+ 370% avec cette stratégie : désolé je ne saisis pas bien l’intérêt .
Aucune immobilisation du capital. Quel est le drawdown du buy & hold ? Je ne l’ai pas calculé moi même, mais cela a dut être difficile en 2008 et 2012 ? Après coup, lorsque l’on a toutes les informations à disposition, certaines stratégies auraient été meilleures que d’autres. Il est vrai que l’on a coutume de comparer les stratégies d’interventions automatique avec le buy&hold sur les indices et les actions, malgré cela, une stratégie qui fait 370% à elle seule et qui peut être incorporé à un portefeuille plus vaste de stratégies automatiques est valable selon moi.
Cette stratégie de mean reversion est tellement simple, qu’il aurait été dommage de ne pas la proposer à tous 🙂
ok pour le codage mais le choix “indice” n’est pas le bon : moins de 5%/an pour le meilleur et pour l’IBEX 1% annuel avec 25% de DD …..
Hi Nicloas nice one i do understand 😀 im trying to put in MA200 as a criteria so it only go long when above how so i do this cant do it 🙁