Hello everyone,
I wrote this code from a strategy that seemed extremely effective on the pair “USD / JPY “.
The problem is that the backtest I had seen did not use the spread, and had been tested over the last few years, which anyway were profitable.
So I rewrote a backtest with adaptation in H1 c
harts and spread of 1.5 points.
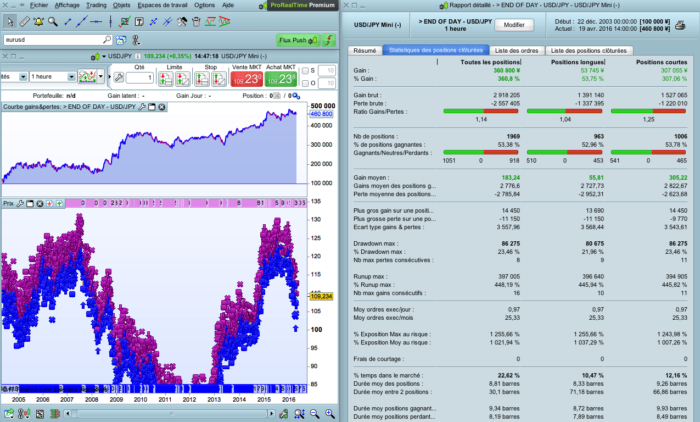
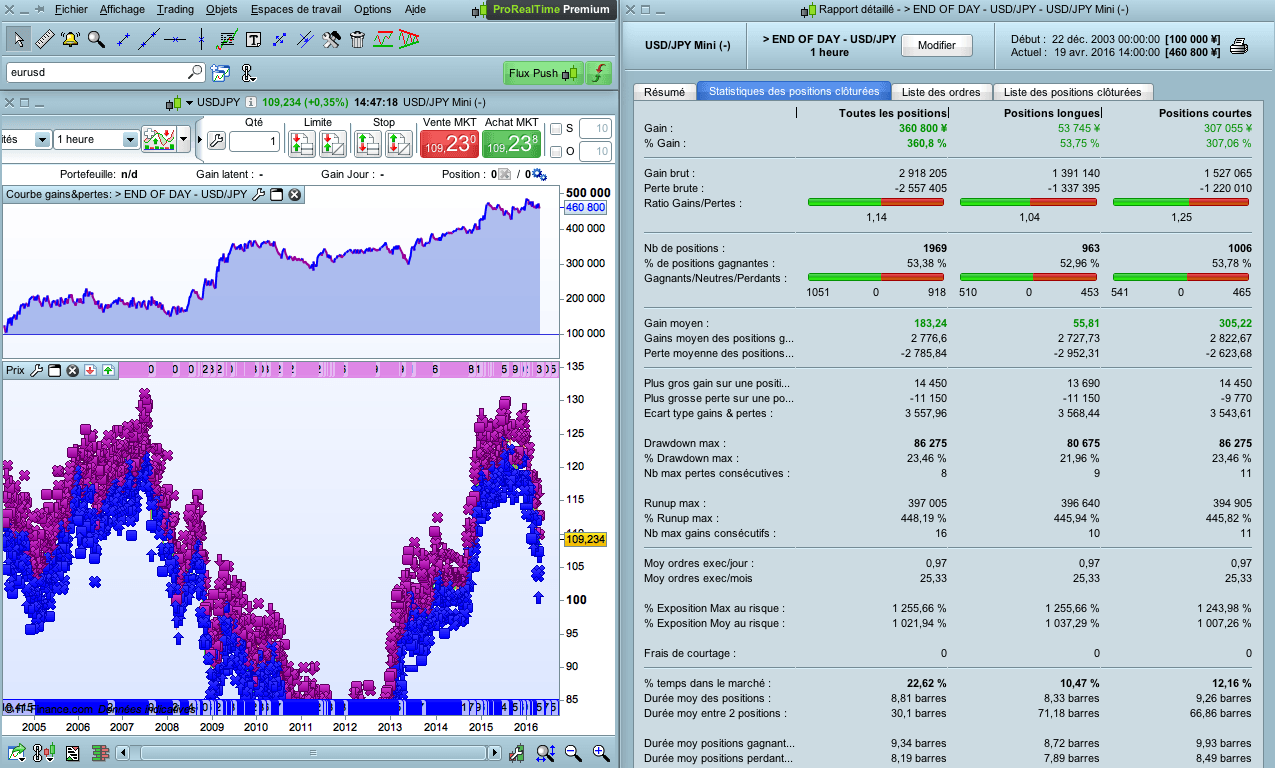
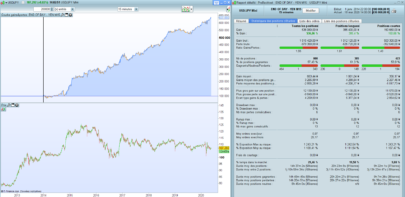
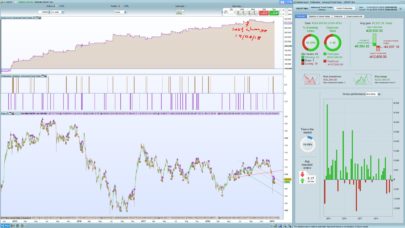
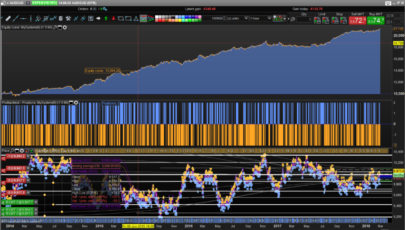
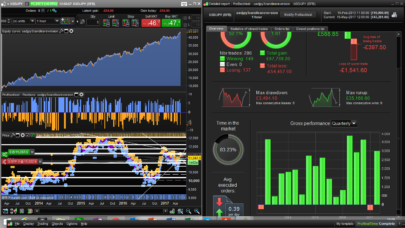
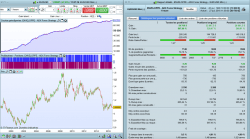
As you can see, the strategy
– is profitable in recent years
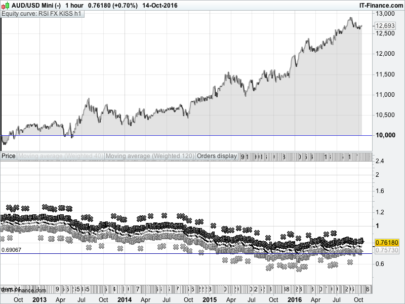
– can be positive on every forex pair (with some improvements for each pair)
– requires no indicator
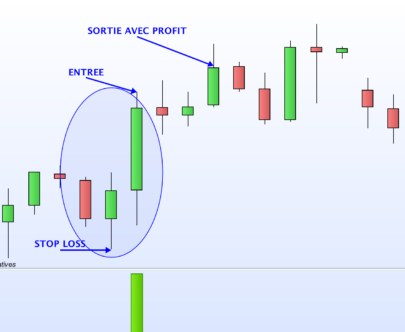
Actually, we take position only between 22H and 23H, depending on the distance from the range period : 18H – 22H (this period can change with other pairs)
|
1 2 3 4 5 6 7 8 9 10 11 12 13 14 15 16 17 18 19 20 21 22 23 24 25 26 27 28 29 30 31 32 33 34 35 36 37 38 39 40 41 42 43 44 |
// Graphes H1 // Paire recommandée : USD/JPY Defparam cumulateorders = false // Levier (max conseillé : 1.5) LEVIER = 1 // Choix du réinvestissement des gains ou non REINV = 0 IF REINV = 0 THEN n = 1*levier ENDIF IF REINV = 1 THEN Capital = 100000 + strategyprofit n = (capital / 100000)*levier IF n <1 THEN n = 1 // Taille minimum : 1 ENDIF ENDIF // Bougie référence 18 à 22H If time = 220000 THEN amplitude = highest[4](high) - lowest[4](low) amplitude = amplitude*0.4 ouverture = close ENDIF // ACHAT & VENTE entre 22H et 23H IF time >= 220000 and time <= 230000 THEN Buy n shares at ouverture - amplitude limit Sellshort n shares at ouverture + amplitude limit ENDIF // STOP & OBJECTIF SET STOP %LOSS 0.6 SET TARGET %PROFIT 1.2 // SORTIE IF time = 100000 THEN SELL AT MARKET EXITSHORT AT MARKET ENDIF |
Share this
No information on this site is investment advice or a solicitation to buy or sell any financial instrument. Past performance is not indicative of future results. Trading may expose you to risk of loss greater than your deposits and is only suitable for experienced investors who have sufficient financial means to bear such risk.
ProRealTime ITF files and other attachments :PRC is also on YouTube, subscribe to our channel for exclusive content and tutorials

Hello,
This seems to be an interresting strategy.
I tried to quickly improve this program and having better result with:
. Close all trades friday evening.
. Open trades only the first 3 days of the week.
Thanks
. Add a stop loss (0,7%).
We get better results with stop loss to %0.6, and no trades on Friday.
But I don’t see the end of my code !
It is :
// ACHAT & VENTE entre 22H et 23H
IF time >= 220000 and time <= 230000 and dayofweek <> 5 THEN
Buy n shares at ouverture - amplitude limit
Sellshort n shares at ouverture + amplitude limit
ENDIF
// STOP & OBJECTIF
SET STOP %LOSS 0.6
SET TARGET %PROFIT 1.2
// SORTIE
IF time = 100000 THEN
SELL AT MARKET
EXITSHORT AT MARKET
ENDIF
I added this line to your code. Now it’s complete I believe.. does it?
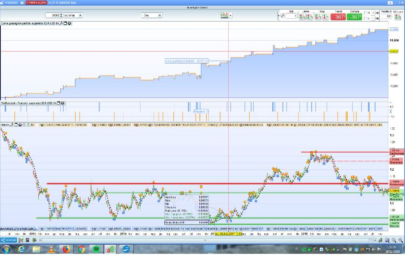
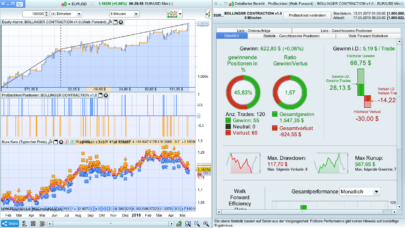
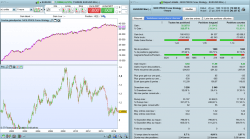
Here is the new screenshot, with stop loss 0,6%, an no trades on Friday.
http://www.doctrading.fr/wp-content/uploads/2016/04/End-of-Day-UsdJpy-V2.png
Better !
Yes, it will be complete with, for line 30 :
IF time >= 220000 and time <= 230000 and dayofweek <> 5 THEN
Thanks !
I tried some other backtests.
I found better results with:
“IF time >= 220000 and time <= 230000 and dayofweek < 4 THEN…”
Close only friday night intead of everyday at 10.
and add a condition in order to trade only in the trend simply calcutated with the difference between 2 different moving average.
then Ratio became over 2 ( with 1.5 pips spread and 150 yen fees to estimate overnight fees)
thanks
Hi,
can i send me the strategy with your improvement ? Thanks
Hi,
Could you send us the PRT code ?
Thanks, I will try.
Hi,
can i have the complete strategy wish the correct parameters for eurusd? Thanks emanuele
Here the modified code.
I’ll start paper trading with this code, because last week, I compared backtest and paper trading with a code like your and it was completly different (better results with paper trading).
Backtest give bad results with “Sell” and “Buy” “at market”. And also, it looks likes “DayOfWeek” fonction is not respaected.
// Graphes H1
// Paire : USD/JPY
Defparam cumulateorders = false
//nombre de lots
N = 1
// Bougies de référence à 22H
IF time = 220000 THEN
amplitude = highest[4](high) - lowest[4](low)
variable = amplitude * 0.4
ouverture = close
tandence = average[83] - average[45]
ENDIF
// ACHAT & VENTE entre 22H et 23H
IF time >= 220000 and time <= 230000 and DAYOFWEEK < 4 THEN
IF tandence > 0 THEN
Buy n shares at ouverture - variable limit
ENDIF
IF tandence < 0 THEN
Sellshort N shares at ouverture + variable limit
ENDIF
ENDIF
// SORTIE le vendredi soir
IF dayofweek =5 AND time >=230000 THEN
SELL AT MARKET
EXITSHORT AT MARKET
ENDIF
// STOP & OBJECTIF
SET STOP %LOSS .8
SET TARGET %PROFIT 5
Hello,
Interesting.But I see a 150.000 yen drawdown, for a inital capital of 200.000.My code has a 62.000 drawdown.It is too risky, according to me. Maybe I did miss something ?
Yes I found more or less same results.
It comes from stop loss & target profit values.
Then with 0.6% and 1.2% (values of you code), you will find quite the same drawdown you have with your code but with a better ratio.
0.8% and 5% gives the better final results but of course an important drawdown, the come from 9 successive lost trades.
If someone have a solution to decrease drawdown with the same final result, please don’t hesitate.
To get the same result with less drawdown, the solution is simple :
you just use the original code, and bet x2 per trade.
The drawdown will double (120.000), but the result be more profitable that your code.
I suggest just betting x1.5
Hi,
I’m new to ProOrder and have imported the original code you posted and backtested it. Only get 3 trades. I’m a doing anything wrong?
After some week of demo mode, I can say:
Backtests are completly wrong, but reality is better than backtest with your code.
Results are better without adding indicator.
Have a nice day.
Thanks for your return.
I think that backtests are good with orders at market, with each new candles ; but there are bad backtests with stop ordres / several orders on same candle.Best Regards,
I’m using this code in real trading ! since 6 weeks , the result is verry profitable. The only difference i using 10min chart
Nicolas,
Thanks for this idea! It is an interesting concept to use mean reversion during the non-main sessions.
Kind regards,
Wilko
What do you mean by this Wilko? I don’t see any comments here by anyone called Nicolas, but more importantly what do you mean by using mean reversion during non-main sessions? Could you explain this in more detail? Are you suggesting that there is a better indicator that could be programmed into this strategy (ie what you describe as a “mean reversion”) and that there is a better time frame to use the strategy (what you describe as the “non-main sessions” – do you mean for this that the strategy should only be active say during the Sydney and Tokyo sessions?)
For a full list of posts been tagged “mean reversion” in the library: https://www.prorealcode.com/tag/mean-reversion/
Thanks Nicolas, I will have a look at those posts you suggest. I take it you are suggesting that these posts will give a definition of what a “Mean Reversion” is or how to program a mean reversion into a strategy. I am hoping to learn to program in ProRealTime in some detail so any suggestion is greatly appreciated.
Hi,
Many thanks for posting this trading system. I know it is old – but I just found it and the backtesting looks fantastic – but that is also where I have issues. When I run backtesting on IG with real trading account I have very nice results. If I try backtesting on my demo account – I get really bad numbers. The quotes are the same, the stops and spreads are the same as well as the paper traded (USD/JPY). It is very peculiar! Anyone knows why?
Regards.
As for today, a new backtest engine is deployed for IG demo accounts, this one has a better accuracy for STOP and LIMIT orders, rounding them correctly for the instrument’s ticksize.
For a proper backtest, you should also always use the tick by tick box checked.
Hi all,
Here is an improvement from a friend, Philippe :
Best Regards
Defparam cumulateorders = false
n=1
// Plus le “ratio” monte, moins il y a de positions prises
ratio=0.7
// Bougie référence 18 à 22H
if time = 220000 THEN
amplitude = highest[4](high) – lowest[4](low)
ouverture = close
endif
// achat & vente en semaine hors vendredi, entre 22H et minuit
if time >= 220000 and time <= 230000 and dayOfWeek 5 then
buy n shares at ouverture – amplituderatio limit sellShort 2.5n shares at ouverture + amplitude*ratio limit
endif
// stop & objectif
sell at ouverture – amplituderatio – 4amplitude stop
exitShort at ouverture + amplituderatio + 3amplitude stop
set target %profit 0.8
// sortie
if time = 50000 then
exitshort at market
endif
if time = 210000 then
sell at market
endif
Sorry for the mistakes… My “Copy – Paste” did’nt work properly.
Defparam cumulateorders = false
n=1
// Plus le “ratio” monte, moins il y a de positions prises
ratio=0.7
// Bougie référence 18 à 22H
if time = 220000 THEN
amplitude = highest[4](high) – lowest[4](low)
ouverture = close
endif
// achat & vente en semaine hors vendredi, entre 22H et minuit
if time >= 220000 and time <= 230000 and dayOfWeek 5 then
buy n shares at ouverture – amplitude*ratio limit
sellShort 2.5*n shares at ouverture + amplitude*ratio limit
endif
// stop & objectif
sell at ouverture – amplitude*ratio – 4*amplitude stop
exitShort at ouverture + amplitude*ratio + 3*amplitude stop
set target %profit 0.8
// sortie
if time = 50000 then
exitshort at market
endif
if time = 210000 then
sell at market
endif
Hi all,
Here is the new version, which is better :
Defparam cumulateorders = false
n=1
// Plus le “ratio” monte, moins il y a de positions prises
ratio = 0.95
// Bougie référence 18 à 22H
if time = 220000 THEN
amplitude = highest[4](high) – lowest[4]low
ouverture = close
endif
// achat & vente en semaine hors vendredi, entre 22H et minuit
if time >= 220000 and time <= 230000 and dayOfWeek 5 then
buy n shares at ouverture – amplitude*ratio limit
sellshort 2.5*n shares at ouverture + amplitude*ratio limit
endif
// stop & objectif
sell at ouverture – amplituderatio – 10*amplitude stop
exitShort at ouverture + amplituderatio + 3*amplitude stop
set target %profit 0.9
// sortie
if time = 50000 then
exitshort at market
endif
if time = 210000 then
sell at market
endif
Unhappily, I can’t join a picture…
Bonjour 🙂
Je sais que cette stratégie a été partagée il y a de ça plusieurs années mais elle a retenu mon attention et je voudrais savoir si certain d’entre vous l’utilisent encore ou l’ont utilisé par le passé ?
Au passage, je suis en train de backtester ma propre adaptation de cette stratégie et j’aurais voulu vos avis sur les résultats que j’obtiens, et notamment celui de Doctrading s’il est encore parmi nous.
Voici la comparaison entre le backtest de la version de Doctrading du 04/19/2016 et ma propre adaptation :
Dates des backtests : du 14/08/16 22:00:00 au 13/08/2021 22:00:00
Actif : USD/JPY en 1h
Nb de trades : Doc 137 _ Malloc 118
Gain : Doc 87 (63.5%) _ Malloc 56 (47.46%)
Flat : Doc 4 (2.92%) _ Malloc 21 (17.8%)
Perte : Doc 46 (33.58%) _ Malloc 41 (34.75%)
Ratio G/P : Doc 2.12 _ Malloc 3.38
Gain moyen : Doc 420.11 _ Malloc 319.11
Gain max : Doc 1260 _ Malloc 1060
Perte moyenne : Doc -373.91_ Malloc -129.02
Perte max : Doc -2060 _ Malloc -540
Runup max : Doc 20140 _ Malloc 12750
Drawdown max : Doc -6340 _ Malloc -1240
Étant assez novice sur le backtesting, je suis preneur de tout avis !
Merci par avance,
Malloc
Hi guys!
Do you know if it is possible to set the buy size to a relative % of the available equity / deposit?
I would like to backtest compound profit by doing “buy 100% of available equity” instead of “buy n shares”.
Thanks a lot