Hello everyone !
Here is a very interesting code and ready to debate.
In fact, I thought I had developed a “perfect” code.
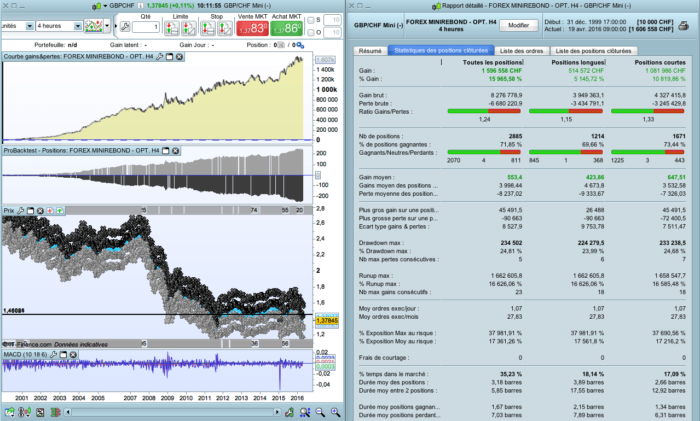
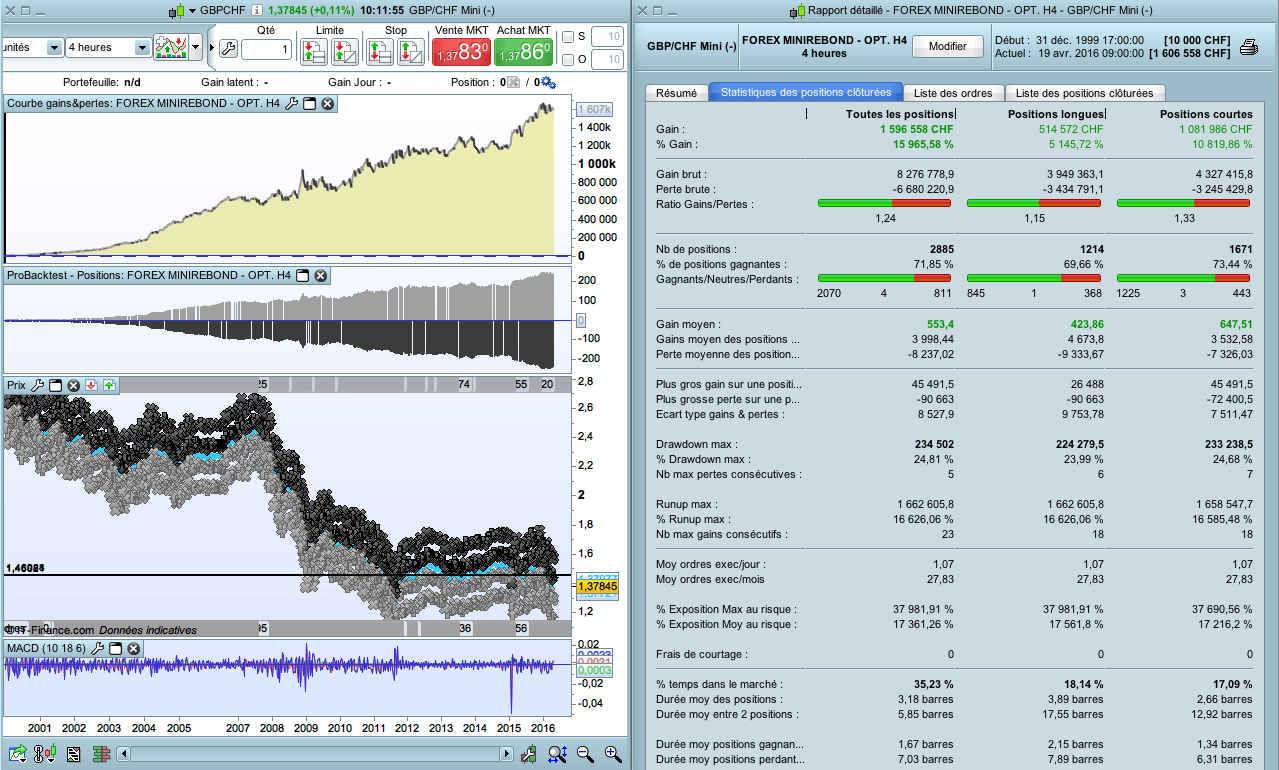
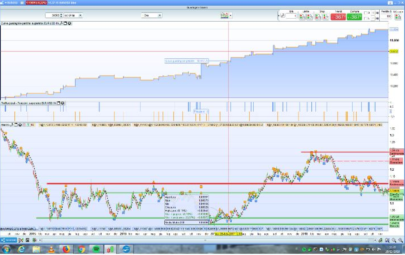
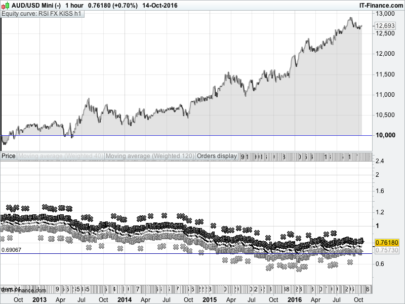
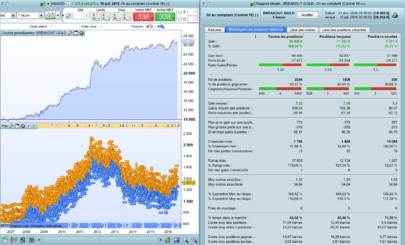
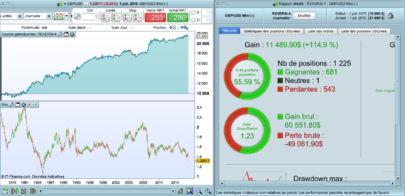
And for good reason : on the GBP/CHF, it transforms (in 16.5 years), 10,000 € in 1.800.000.000 € in H1 charts, and in 1,000,000 € on H4 charts !
The problem is that I forgot the spread.
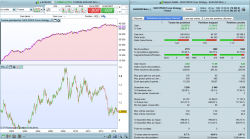
With a spread of 5 points, it falls to € 243,000 in H4 graphs while the performance is bad in H1 graphs !
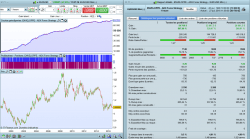
Fortunately, in H4 graph the progress of capital curve is very smooth, and with a leverage of 1.5 we go to 1.5 million € of gains, with a drawdown from 16 to 25%, still acceptable.
And we can run this strategy automatically.
Curiously, it is far less profitable than my own algorithms that are set in DAILY graphs ; the spread kills everything, I begin to understand why some professional traders say that they only trade on Daily charts…
So here is the code.
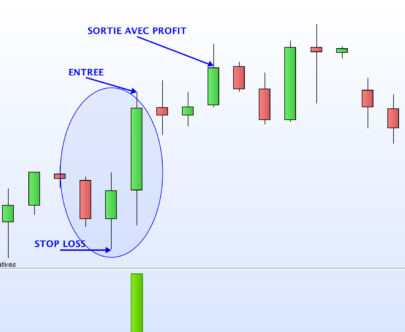
It plays with rebounds in trend, defined by a moving averages channel, and MACD.
The code is optimized for the graphs in H4.
It works on almost all pairs of forex, but need to adjust depending on the timeframe (variable at the entry and exit points).
It required a lot of work from myself, I thought using automatic… but I will stay on my strategies in “Daily », which are finally far more efficient.
Even the “Breakout CAC40” is more efficient from 2008 to 2016.
Too bad, because the strategy seems very reliable and logical.
|
1 2 3 4 5 6 7 8 9 10 11 12 13 14 15 16 17 18 19 20 21 22 23 24 25 26 27 28 29 30 31 32 33 34 35 36 37 38 39 40 41 42 43 44 45 46 47 48 49 50 |
DEFPARAM CumulateOrders = false // TAILLE DES POSITIONS REINV = 1 // Mettre "0" pour ne pas avoir de réinvestissement des gains levier = 1.5 IF REINV = 0 THEN n = levier // pas de réinvestissement ENDIF IF REINV = 1 THEN // réinvestissement capital = 10000 + strategyprofit n = (capital / 10000) *levier ENDIF // DEFINITION DES INDICATEURS MM3LOW = Average[2](low[1]) MM3HIGH = Average[2](high[1]) IndicMACD = MACD[10,18,6](close) // ACHAT // Conditions pour ouvrir une position acheteuse c1a = (IndicMACD > 0) NivOuverturePasse = Open[4] IF c1a AND NivOuverturePasse < MM3LOW THEN BUY n SHARES AT (MM3LOW-0.001) limit ENDIF // Conditions pour fermer une position acheteuse SELL AT (MM3HIGH+0.001) limit // VENTE A DECOUVERT // Conditions pour vendre à découvert c1v = (IndicMACD < 0) NivOuverturePasse2 = Open[6] IF c1v AND NivOuverturePasse2 > MM3HIGH THEN sellshort n SHARES AT (MM3HIGH+0.0005) limit ENDIF // Conditions pour fermer une position vendeuse exitshort AT (MM3LOW+0.0005) limit // STOP LOSS : NON |
Share this
No information on this site is investment advice or a solicitation to buy or sell any financial instrument. Past performance is not indicative of future results. Trading may expose you to risk of loss greater than your deposits and is only suitable for experienced investors who have sufficient financial means to bear such risk.
ProRealTime ITF files and other attachments :PRC is also on YouTube, subscribe to our channel for exclusive content and tutorials



Thank you very much for the code, Doctrading!
You’re welcome 🙂
I’m preparing another one soon.
Great Doc ! have you tried to use the time frame to 5 H? I think it works better.. 🙂
Hello,
It should work on all timeframe >= H4 (because of spread).
I didn’t try it on other timeframes that H4 and D1, but sure it would work.
Hello,
Your code works very well in backtest in a H4 timeframe with EURUSD, EURGBP and EURCHF. I made a little modification = SET STOP pTRAILING 4.
I was so enthousiast, I tried it on DAX and CAC40 futures : in paper trading, it’s fabulous ! I need to limit the size of the position with a test.
He put 4 instances of this code in automatic mode in H4 (EURUSD, EURGBP, DAX, CAC) ; it’s my first trial of PRT.I will give you more feedback tomorrow.
XBKZ
Hi Doc,
I have just tested and optimized the code for a nice backtest (26/02/2016 to 06/05/2016).
DEFPARAM CumulateOrders = false
SET STOP $LOSS 5
// TAILLE DES POSITIONS
REINV = 0 // Mettre \"0\" pour ne pas avoir de réinvestissement des gains
levier = 100
IF REINV = 0 THEN
n = levier // pas de réinvestissement
ENDIF
IF REINV = 1 THEN // réinvestissement
capital = 100 + strategyprofit
n = (capital / 10000) *levier
ENDIF
// DEFINITION DES INDICATEURS
MM3LOW = Average[2](low[1])
MM3HIGH = Average[2](high[1])
IndicMACD = MACD[10,18,6](close)
// ACHAT
// Conditions pour ouvrir une position acheteuse
c1a = (IndicMACD > 0)
NivOuverturePasse = Open[4]
IF c1a AND NivOuverturePasse < MM3LOW THEN
BUY n SHARES AT (MM3LOW-0.001) limit
ENDIF
// Conditions pour fermer une position acheteuse
SELL AT (MM3HIGH+0.001) limit
// VENTE A DECOUVERT
// Conditions pour vendre à découvert
c1v = (IndicMACD < 0)
NivOuverturePasse2 = Open[6]
IF c1v AND NivOuverturePasse2 > MM3HIGH THEN
sellshort n SHARES AT (MM3HIGH+0.0005) limit
ENDIF
// Conditions pour fermer une position vendeuse
exitshort AT (MM3LOW+0.0005) limit
// STOP LOSS : NON
Link to PRT BackTest capture: http://s32.postimg.org/ukw5tx0g5/Bounc.png
BEWARE !!
Your “set stop ptraling 4” makes the backtest NONSENSE !
Because it will only consider winning trades. The equity curve is too beautiful to be real.
Don’t use it with real money like this, you will loose.
Hi Doctrading
could you elaborate a bit more the reason why the instruction SET STOP pTRAILING 4 makes the backtest nosense?
Does this mean that the trailing stop in backtest give misleading results? Why?
Thanks in advance
Hi Doc,
I’m trying to avoid big losses per trade.
I’m running the original Forex BOUNCE and I’m reaching -125,50$ (worst) versus +77,50$ (best). Back-tested H4 (26/02/2016 to 06/05/2016).
http://s32.postimg.org/lvrst1yx1/Capture1.png
http://s32.postimg.org/5zrh9egw5/Capture2.png
My issue is that with an initial capital of 100 $ as per example, the strategy looks very risky.
What’s your opinion about it?
Hello cryoxdsl,
Strange that you have such a profit factor…
Did you set also the spread ?
Do you use the same code ?
Without seeing your code and the equity curve, it would be difficult for me to answer your question…
Hi Doc,
The spread is set to a large value (3.8).
The code is :
DEFPARAM CumulateOrders = false
// TAILLE DES POSITIONS
REINV = 0
levier = 1
IF REINV = 0 THEN
n = levier // pas de réinvestissement
ENDIF
IF REINV = 1 THEN
capital = 100 + strategyprofit
n = (capital / 100) *levier*1.5// réinvestissement
ENDIF
// DEFINITION DES INDICATEURS
MM3LOW = Average[2](low[1])
MM3HIGH = Average[2](high[1])
IndicMACD = MACD[10,18,6](close)
// ACHAT
// Conditions pour ouvrir une position acheteuse
c1a = (IndicMACD > 0)
NivOuverturePasse = Open[4]
IF c1a AND NivOuverturePasse < MM3LOW THEN
BUY n SHARES AT (MM3LOW-0.001) limit
ENDIF
// Conditions pour fermer une position acheteuse
SELL AT (MM3HIGH+0.001) limit
// VENTE A DECOUVERT
// Conditions pour vendre à découvert
c1v = (IndicMACD < 0)
NivOuverturePasse2 = Open[6]
IF c1v AND NivOuverturePasse2 > MM3HIGH THEN
sellshort n SHARES AT (MM3HIGH+0.0005) limit
ENDIF
// Conditions pour fermer une position vendeuse
exitshort AT (MM3LOW+0.0005) limit
// STOP LOSS : NON
//SET STOP $LOSS 100
The equity curve : http://s32.postimg.org/ru83q7wn9/Capture4.png
For information, I use the strategy on EUR/USD Mini.
Hi,
do you use in real ? What code ? In can use in real too on EURUSD mini 4H. Tanks
Ok, I will check it and I will tell you my opinion soon.
Hello cryoxdsl,
Even if the strategy is profitable, you must test the strategy not only on 1 year, but on ALL years.
You will see that it is profitable on the long term…But with only $100 capital, you will suffer big drawdown that will erease your account.
It has been profitable since 2015. But from 2010 to 2015, it didn’t earn money, it did loose some, more than your $100 capital.
Best regards,
Hi Doc,
This is what I figured out.
It’s profitable running the strategy at least on a $500 capital and for more security/best results $2000 looks clearly good.
Thanks for your advice.
Hi,
yes, but you should look at drawdown. It shouldn’t exceed 30% to 40% of your capital (as you wish), for this kind of speculative strategy.
You can test it with a $2000 account, on all years.Regards,
HI Doc ,
i love this code although during my backtests i’m getting very different results each day i have a test account i was getting ready to let this code play with £400 the first day i set the parameters with a 3 point spread and had good result since then i have not been able to get it to give me the same result twice in a row would you mind advising me on where i might be going wrong ?
Kind regards
Charlie
// Conditions to enter long positions
DEFPARAM CumulateOrders = false
// TAILLE DES POSITIONS
REINV = 1 // Mettre \"0\" pour ne pas avoir de réinvestissement des gains
levier = 1.5
IF REINV = 0 THEN
n = levier // pas de réinvestissement
ENDIF
IF REINV = 1 THEN // réinvestissement
capital = 10000 + strategyprofit
n = (capital / 1000) *levier
ENDIF
// DEFINITION DES INDICATEURS
MM3LOW = Average[2](low[1])
MM3HIGH = Average[2](high[1])
IndicMACD = MACD[10,18,6](close)
// ACHAT
// Conditions pour ouvrir une position acheteuse
c1a = (IndicMACD > 0)
NivOuverturePasse = Open[4]
IF c1a AND NivOuverturePasse < MM3LOW THEN
BUY n SHARES AT (MM3LOW-0.001) limit
ENDIF
// Conditions pour fermer une position acheteuse
SELL AT (MM3HIGH+0.001) limit
// VENTE A DECOUVERT
// Conditions pour vendre à découvert
c1v = (IndicMACD < 0)
NivOuverturePasse2 = Open[6]
IF c1v AND NivOuverturePasse2 > MM3HIGH THEN
sellshort n SHARES AT (MM3HIGH+0.0005) limit
ENDIF
// Conditions pour fermer une position vendeuse
exitshort AT (MM3LOW+0.0005) limit
// STOP LOSS : NON
Hello Charlie,
If you have different results, I suppose that the test was done with different parameters :
date of beginning / ending
spread
the code itself
Usually, it is the date that changes.
thanks doc i got it working better now still a bit out of kilter but i’m working on trying to get it to get it with the same results
HI all ,
I’am testing the strategy with 5min timeframe with SLoss and Tprofit
It seems work but in back test there are some trade ‘strange’ , ex: some buy trade with noir candle with positive equity curve and some sell trade with green candle with positive equity curve .
REally the strategy take the Stop loss for also trade , because obviuslly the order follow the direction of the market
Do you know this problem ?
Thanks & regards
just all informations
the code is the same Forex AUD/USD mini
, with reinv = 0 , levrier 2, SL 15$ and TP12$
Thanks
Hello Doc!I have a hard time understanding what the code does, could you possibly give a quick summary?I hope I’m not bothering you, I’m just trying to learn.Cheers!
Hello,
You don’t bother anything of us, we are all here to share and learn.
The code takes bounces on a 2 period moving averages channel.
In an uptrend (defined by a MACD > 0), it takes “long” trades on the low of the channel, and sells on the high of the channel.Best Regards,
Much appreciated, thank you!
prejudice I follow the forum recently, I tried with tick by tick charts seem to give better results, but automatically ProRealTime ago not to use them, volvo saperese qualquno can create the same code that gives the alert signals on daa graphics to use in a semi automatic with manual insertion orders. thank you
There’s an issue with automatic trading.Because the backtest only takes 1 order per candle, whereas in real automated trading, it can take 10 or more trades !
Actually, the price doesn’t go straight from one point to another one, it oscillates several times.So I will fix this issue, with only 1 trade per day, or if possible 1 trade per candle (but I don’t know how to write it yet).
Actually, I think that the man who did test it on demo account with automated trading forgot to write :
Defparam cumulateorders = false
It must work well with it.
hello doctrading, many thanks to share your strategy, from one month I applied your strategy in some pair of forex with good result, I think that it’s very interesting code, in some pair of forex I used in h1 timeframe, please can you suggest me how I can do to change entry and exit point for this timeframe? many thanks and I hope in your reply
bye
Hello,
Actually it’s quite risky to trade on smaller timeframes : slippage, spread, big movements, etc.
Buy you can use the “optimization of variables” function, near the entry / exit points.Best regards,
thank you doc….
bye
Hallo doc, thank again for your strategy but can you suggest me an example of the optimization of the parameter to use in 1h timeframe on gbp based forex exchange?
thanks again and I hope in your reply…good weekend!
Do NOT take this system live! The backtest results will never be repeated live due to a shortcoming in PRT backtest, or rather 2 shortcomings:
1. If one issues limit orders to both enter and exit and both levels are within the range of the next candle, PRT will automatically assume that the entry order is performed before the exit order. This will happen in spite of backtesting in tick-by-tick mode. This will give backtest a positive skew which is proportional to the number of trades where both entry and exit happen in same candle with limit or stop orders.
2. This system issues limit orders for both longs and shorts. PRT cannot correctly handle simultaneous longs and shorts.
In short, the backtest for this system will never be even close to reality. In reality, this system is likely to on average end up losing very close to the spread or transaction cost.
These are among some more experienced users known shortcomings in PRT but unfortuntely not well described in the manual.
Again, my strong recommendation is to not take this system live.
So I’ve played around with this just recently and have achieved some good results in an IG demo account. Win rates from 65 to 70% across a number of markets including Brent crude (4HR) GBP AUD (10 min) EUR AUD (4HR) USd CHF (4HR). win lose ratio in the order of 1.3:1. Using fairly tight stops and targets. This is a months worth of data -will let it run another 60 days.