







Heikin Ashi during trend
Hello,
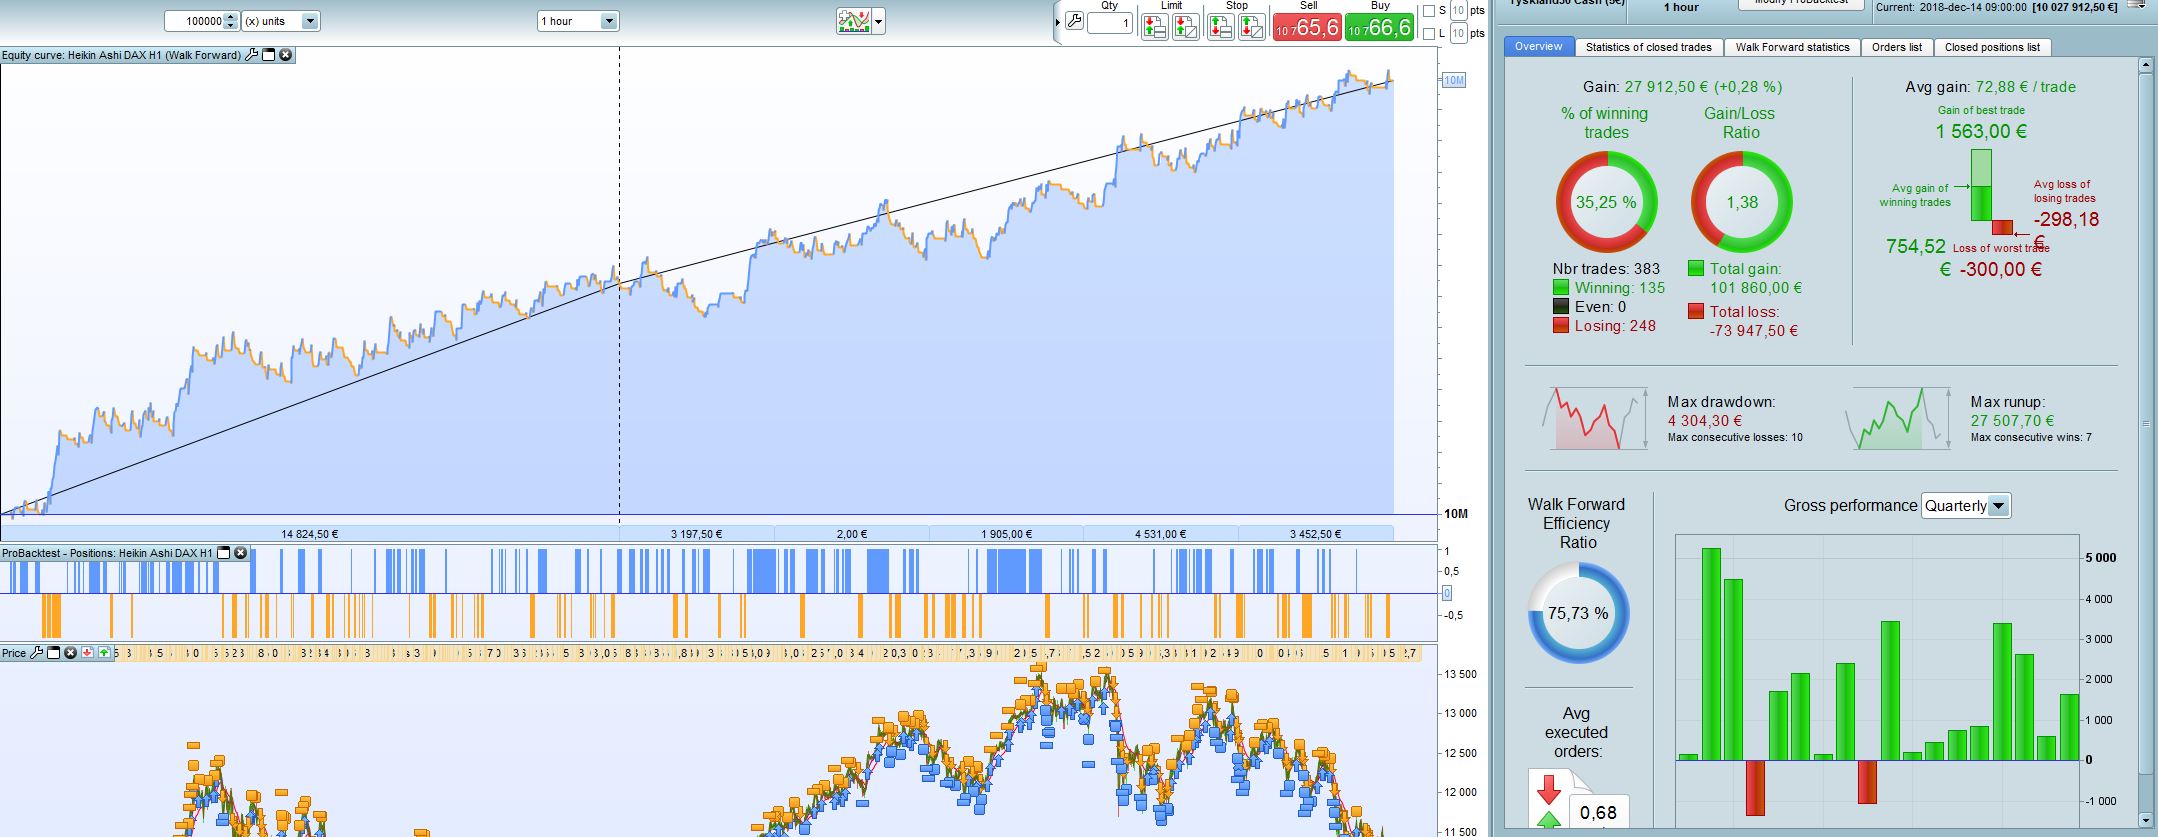
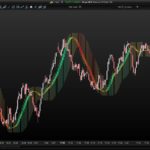
This is one of my first strategies. It is a simple strategy with Heikin Ashi as a trigger during trends. It buys according to Heikin Ashi but only during uptrend set by EMA 25, 50 and 270. It sells acoording to HEikin ashi but only during trends (same EMA).
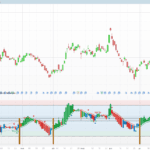
My question is of course if anyone have any improvement tips, but also my concenr for curve fitting and lack of robustness. I have tried to not make to many adjustments and I did my settings on about 28 months IS and then added another 7 months as OOS. The strategy works on DAX H1 and I didnt find any other markjet that worked well. I had the spread set to 2 for this backtest.
Please let me know your thoughts.
(please download the attached file to get all necessary codes).
//DAX H1 Heikin Ashi
Defparam cumulateorders = false

rangestart = 090000
rangeend = 170000

n = 1
Takeprofit = 150
Stoploss = 60

C3 = ExponentialAverage[25](close)//BLACK
C4 = ExponentialAverage[50](close)//RED
C5 = ExponentialAverage[270](close)//RED
indicator1 = CALL "Heiken Ashi"
c1 = (indicator1 = -1)
c2 = (indicator1 = 1)

IF time > rangestart AND time < rangeend AND c2 AND C4 > C5 AND C3 > C4 THEN
 BUY n shares AT MARKET
 Set target pprofit Takeprofit
 SET STOP pLOSS Stoploss
Else
 If time > rangestart AND time < rangeend AND c1 AND C4 < C5 AND C3 < C4 THEN
  Sellshort n shares at market
  Set target pprofit Takeprofit
  SET STOP pLOSS Stoploss
 ENDIF
endif

Comments
You must be logged in to post a comment.

Works with US Crude at 1h as well!


Paul, Im sorry but where do I open a topic?
Many thanks Paul! I will look at it tomorrow (Im using my phone now).
It has only 1 trade a day and the profit target is not used. Because it trades a complete day, I included an option not to enter new positions during lunchbreak, because of a higher risk. Perhaps it's curve-fitting, but it does make sense to me. (11.30-13.30) //------------------------------------------------------------------------- // Main Code : Heikin Ashi trend //------------------------------------------------------------------------- // Common Rules Defparam Cumulateorders = False Defparam Preloadbars = 1000 // On/off Extratradecriteria = 1 // I.e. Long; Only Enters When The Current Bar High Is Lower Then The Lowest Daily High From Today, Yesterday And Day Before. Mfetrailing = 1 // Mfe Trailing Stop Wtrailing = 1 // Williams 3 Bar Trailing Stop Breakevenstop = 1 // Breakevenstop, Move Stoploss When Position Is In Profit. Excludefirsttwoweeks = 1 // Exclude The First 2 Weeks Of Every Year (Weeknumber 1 And 2) lunchtrading = 0 // [0] no new positions during lunchtime and trades can be closed // Settings Positionsize = 1 SL = 1.00 // % Stoploss PT = 140 // % Profit Target MFETS = 0.50 // % Mfe Trailing Stop BES = 0.35 // % Break Even Stop BESMP = 0.05 // % Break Even Stop Minimum Profit WTSMP = 0.50 // % Williams Trailing Stop Minimum Profit If Mfe Trailing Stop Is Not Used ETD = 0 // Exclude a Trade Day; Sunday = 0 // Day & Time Once Entertime = 090000 Once Lasttime = 170000 Once Closetime = 240000 // Greater Then 23.59 Means It Continues Position Overnight Once Closetimefr=173000 if lunchtrading then once breakstart = 240000 once breakend = 240000 else once breakstart = 113000 once breakend = 133000 endif If Excludefirsttwoweeks=1 Then If Year=2015 And Month=1 And (Day>=1 And Day=1 And Day=1 And Day=1 And Day=1 And Day= Entertime Tt2 = Time = breakstart and time <= breakend Tradetime = Tt1 And Tt2 and Notrading = 0 And Dayofweek ETD and not breaktime // Reset At Start If Intradaybarindex = 0 Then Longtradecounter = 0 Shorttradecounter = 0 Tradecounter = 0 Mclong = 0 Mcshort = 0 Endif // [pc] Position Criteria Pclong = Countoflongshares < 1 And Longtradecounter < 1 And Tradecounter TRADEINDEX Pcshort = Countofshortshares < 1 And Shorttradecounter < 1 And Tradecounter TRADEINDEX // [mc] main criteria if tradetime then C3 = ExponentialAverage[32](close)//BLACK C4 = ExponentialAverage[48](close)//RED C5 = ExponentialAverage[192](close)//RED indicator1 = CALL "Heiken Ashi" c1 = (indicator1 = -1) c2 = (indicator1 = 1) IF c2 AND C4 > C5 AND C3 > C4 THEN mclong=1 mcshort=0 else mclong=0 endif If c1 AND C4 < C5 AND C3 < C4 THEN mcshort=1 mclong=0 else mcshort=0 ENDIF endif // [ec] Extra Criteria If Extratradecriteria Then Min1 = Min(Dhigh(0),dhigh(1)) Min2 = Min(Dhigh(1),dhigh(2)) Max1 = Max(Dlow(0),dlow(1)) Max2 = Max(Dlow(1),dlow(2)) Eclong = High Max(Max1,max2) else Eclong=1 Ecshort=1 Endif // Long & Short Entry If not onmarket and Tradetime Then If Pclong and Mclong And Eclong Then Buy Positionsize Contract At Market Longtradecounter=longtradecounter + 1 Tradecounter=tradecounter+1 Endif If Pcshort and Mcshort And Ecshort Then Sellshort Positionsize Contract At Market Shorttradecounter=shorttradecounter + 1 Tradecounter=tradecounter+1 Endif Endif // Break Even Stop If Breakevenstop Then If Not Onmarket Then Newsl=0 Endif If Longonmarket And close-tradeprice(1)>=((Tradeprice/100)*BES)*pipsize Then Newsl = Tradeprice(1)+((Tradeprice/100)*BESMP)*pipsize Endif If Shortonmarket And Tradeprice(1)-close>=((Tradeprice/100)*BES)*pipsize Then Newsl = Tradeprice(1)-((Tradeprice/100)*BESMP)*pipsize Endif If Newsl>0 Then Sell At Newsl Stop Exitshort At Newsl Stop Endif Endif // Exit Mfe Trailing Stop If Mfetrailing Then Trailingstop = (Tradeprice/100)*MFETS If Not Onmarket Then Maxprice = 0 Minprice = Close Priceexit = 0 Endif If Longonmarket Then Maxprice = Max(Maxprice,close) If Maxprice-tradeprice(1)>=trailingstop*pipsize Then Priceexit = Maxprice-trailingstop*pipsize Endif Endif If Shortonmarket Then Minprice = Min(Minprice,close) If Tradeprice(1)-minprice>=trailingstop*pipsize Then Priceexit = Minprice+trailingstop*pipsize Endif Endif If Onmarket And Wtrailing=0 And Priceexit>0 Then Sell At Market Exitshort At Market Endif Endif // Exit Williams Trailing Stop If Wtrailing Then Count=1 I=0 J=i+1 Tot=0 While Count=low[i]) And (High[j]alto[1] Then Ref=basso Endif If CloseWTSMP Then If Low[1]>ref And High<ref Then Sell At Market Endif If High[1]ref Then Exitshort At Market Endif Endif If Onmarket And Mfetrailing=1 And Priceexit>0 Then If Highref Then Exitshort At Market Endif Endif Endif // Exit At Closetime If Onmarket Then If Time >= Closetime Then Sell At Market Exitshort At Market Endif Endif // Exit At Closetime Friday If Onmarket Then If (Currentdayofweek=5 And Time>=closetimefr) Then Sell At Market Exitshort At Market Endif Endif // Build-in Exit Set Stop %loss SL Set Target %profit PT //graph 0 Coloured(300,0,0) As "Zeroline" //graph (Positionperf*100)coloured(0,0,0,255) As "Positionperformance"
Thanks Paul for taking your time looking in to this. Could you please insert your code? I will let you know if I find something.
Thanks for posting. I took my SDO strategy, removed the main criteria and inserted your code to match. Results look good for 10 min bar but not on all 200k bars. From jan 2016 it's good. (before that about even) Tested with 1 position, stoploss 1% and spread 1. From 1 jan. 2016 winratio at 73% with average gain 23 euro on 153 trades. 3 losses in a row and 15 wins. Total profit about €3500 So maybe the basis is alright but it just needs a few extra filters to succeed.
Thank you for the feedback jebus. I totally agree on every point.

The more loss in a row you have, the more big winners u need in the future. With a belo 50% winrate, ur gonna need some big winners to save u from loosing 15 trades in a row.. That means ur backtest might be very dependant on a few big winners to make up for all the loss. Increasing the risk of datamining and curvefitting. Also alot of trades lost in a row is going to be very hard to actually trade. Imagine going 9 trades loosing in a row on the same strategy its going to feel like bleeding out, and its gonna leave u praying for a winner to come. what if it dosnt come for another 12 months.. Many loss in a row, frequently haves me thinking ur entry isnt so good. It dosnt mean 100% sure the strategy is bad, it just at least for me is a few red flags that i would definitly think twice about b4 running live at least. Also when you find it hard to make it good in other markets, that again is indeed a red flag regarding the average trade u take.. If u get a decent backtest in other markets that means u havnt curvefitted your algo to "cherrypick" the very best trades from the other optimized market. It means u just might ahve something that pulls profit out of the chart, regardless what chart. Thats kind of the clue behind robustness. You dont want a backtest that has cherrypicked alot of good trades from the data. U want a backtest that has even profits, a good sharpe, low volatility in the equity curve, but obviously not a traight line, u want some bumps here and there because u cant always be right.
jebus89, thank you for your feedback. You are correct, the backtest is made on 100K. The bad result for 200K and the fact that I couldnt find other markets for this is not promising. You also mentioned the loss in a row. I guess yoy see this together with the other facts from the backtest? Loss in arow alone shouldnt be a fact to reject a strategy. It depends on the relation between SL and TP as well as the end result, or what do you think?
Je préconise de regarder les graphiques H1 et M15 pour visualiser la tendance de fond et d'entrer sur le marcher au minimum sur un graph M5 ne pas oublier que c'est déjà au moins 5 mn de retard par rapport au départ de la vague qui aurait déjà pu changer de sens ce qui n'empêcherait pas une sortie positive au regard de la tendance de fond j'aime bien rentrer lorsque le prix croise une MMT (triangularAverage[9] en Heikin-Ashi (Tout ce qui est automatique n'est pas forcément et loin s'en faut le reflet d'une stratégie appliquée en manuel ) Le marché bouge de façon très aléatoire rien ni personne ni aucun indicateur ne peut prédire de façon fiable la couleur de la ou des prochaines bougies ! Le meilleur indicateur c'est vous, votre regard sur un graphique vous pouvez faire du trading très court court ou long terme sans aucun autre indicateur qu'un graphique et une seule MM Les stratégies les plus simples sont très souvent les plus profitables (ou encore trader uniquement sur le carnet d'ordre) Les débutants et même d'autres sont souvent noyés dans un nombre trop important d'indicateur et de stratégies jusqu'à ce qu'ils comprenne que le plus simple appliqué avec rigueur et le plus profitable (Comme plus de 90% des trader j'ai griller des économies avant de comprendre cela) maintenant je sais plus comment faire pour perdre (rire)