

Larry Williams' X bars & Linear Regression Slope
Hello everyone,
Do you remember Larry Williams’ 3 bars strategy?
Well, I tried to automate this strategy.
Without much success at the beginning, I admit, with the basic parameters.
I wanted to optimize it by adding a trend indicator, and changing the value of the moving averages.
Among many trend indicators (MACD, long period stochastics, Ichimoku, moving averages, etc.), I finally chose to keep a simple one : the slope of linear regression.
Moreover, this new approach remains in position as long as the linear regression slope is well oriented : the trade is not closed only by the price crossing above / below a moving average.
So I show you a simple code, which trades the bounces in trend, at the level of the bottom or the top of a channel of moving averages.
For the backtest to be efficient, it must be optimized according to the action / index / currency pair concerned.
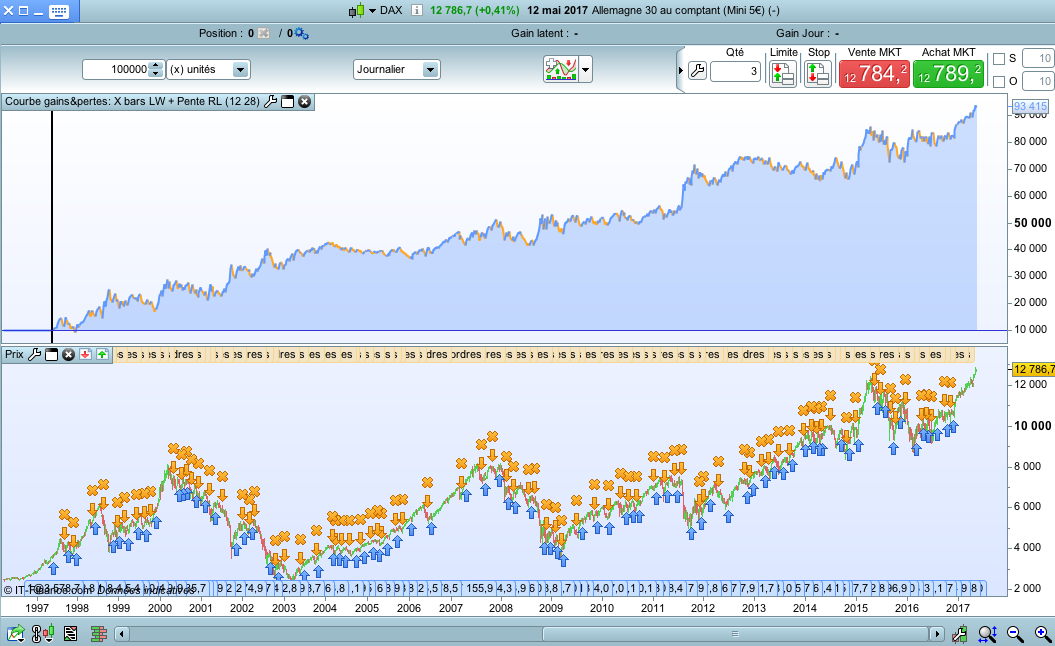
Here is an example on the DAX, in graphs Daily, with 1 point of spread, over the last 20 years round.
Moving averages period : 12
Slope of linear regression : 28
// Stratégie : X bars de Larry Williams + Pente régression linéaire
// www.doctrading.fr

// Paramètres (à optimiser) :
mm = 12
rl = 28

MMhaute = average[mm](high)
MMbasse = average[mm](low)

PenteRL=LinearRegressionSlope[rl](TotalPrice)

// ACHAT

IF not longOnMarket AND PenteRL[1] > 0 THEN
 BUY 1 shares AT MMbasse[1] limit
ENDIF

If longonmarket and PenteRL[1] < 0 THEN
 SELL at MMhaute[1] limit
ENDIF


// VENTE

IF not shortonmarket AND PenteRL[1] < 0 THEN
 SELLSHORT 1 shares AT MMhaute[1] limit
ENDIF

If shortonmarket and PenteRL[1] > 0 THEN
 EXITSHORT at MMbasse[1] limit
ENDIF